Introduction
Role
Principal Investigator
Timeline
February 2024 - May 2024
Team
Personal Project
Tools & Methods
Eye-tracker,
Facial Expression Analysis,
Quantitative Research,
Qualitative Research,
SPSS.
Cannabis labels have a lot of information on them which can make them difficult to notice important information and to interpret it.
Optimizing User Interaction and Information Processing on Drug Labels
Given the potential for negative effects from cannabis consumption, it is vital that appropriate packaging and labeling regulations are developed that will encourage consumers to notice important information pertaining to potency and warnings, and also ensure that they are be able to understand the information the label is trying to convey.
Thus, this study was interested in understanding how varying the presentation of information on cannabis labels can impact attention and comprehension.
Process

Phase 1: Eye-tracking &
Facial Expression Analysis
Statistical Analysis (SPSS)
Data Synthesis
Presentation
Recruitment
Phase 2: Comprehension
Test + Subjective Opinions
Setup & Apparatus

Phase 1: Eye-tracking & Facial Expression Analysis
Phase 1 of the study was a 3 x 3 factorial within-subjects full factorial design study where each participant experienced 9 conditions. Each condition involved a participant viewing a specific combination of:
This table demonstrates the layout of for this phase of the experiment. There were 9 conditions in total which each participant experienced.
Dependent variables
a) Eye tracking metrics:
Saccade count, well time, and average fixation duration.
b) Facial expressions and behaviors:
Confusion, contempt, engagement, negative, brow furrow, inner brow raise, neutral.
Independent variables:
a) Presentation of Potency information
(i) MG, (ii) THC %, (iii) Traffic light indication;
b) Presentation of Cannabis Warning Label (CWL)
(i) Bullet Points (ii) Original %, (iii) Symbols.
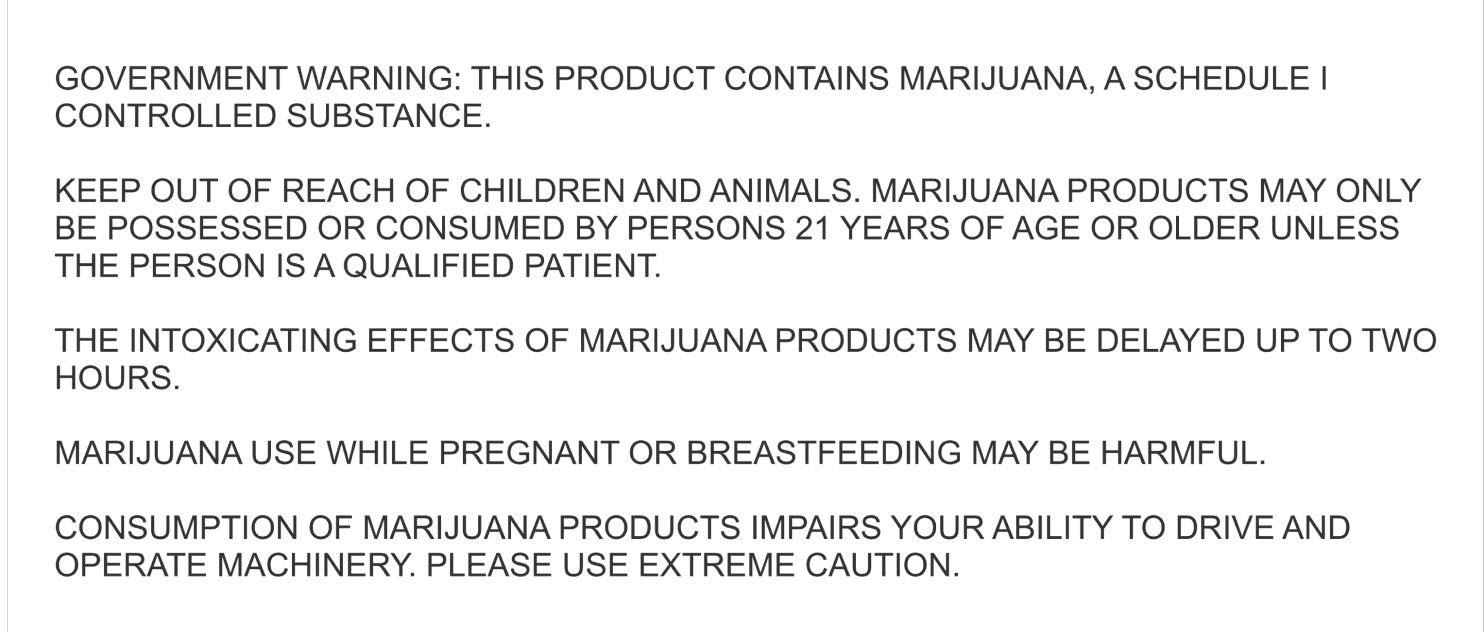
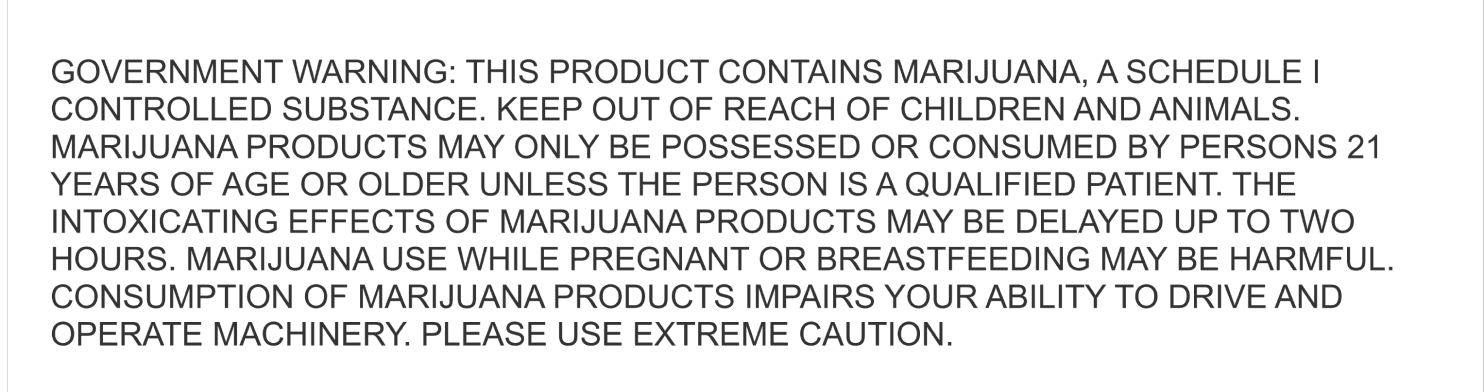
Presentation of Cannabis Warning Label
Presentation of Potency Information
MG
HIGH
HIGH
HIGH
LOW
LOW
LOW
MG x Original
x HIGH
MG x Original
x LOW
MG x Bullet Points x HIGH
MG x Bullet Points x LOW
MG x Symbols x HIGH
MG x Symbols x LOW
THC % x Original x
HIGH
THC % x Original x
LOW
THC % x Bullet Points x
HIGH
THC % x Bullet Points x
LOW
THC % x Symbols
x HIGH
THC % x Symbols
x LOW
Traffic Light x Original x HIGH
Traffic Light x Original x LOW
Traffic Light x Bullet Points x HIGH
Traffic Light x Bullet Points x LOW
Traffic Light x Symbols x
HIGH
Traffic Light x Symbols x
LOW
Original
Bullet Points
Symbols
THC %
Traffic Light
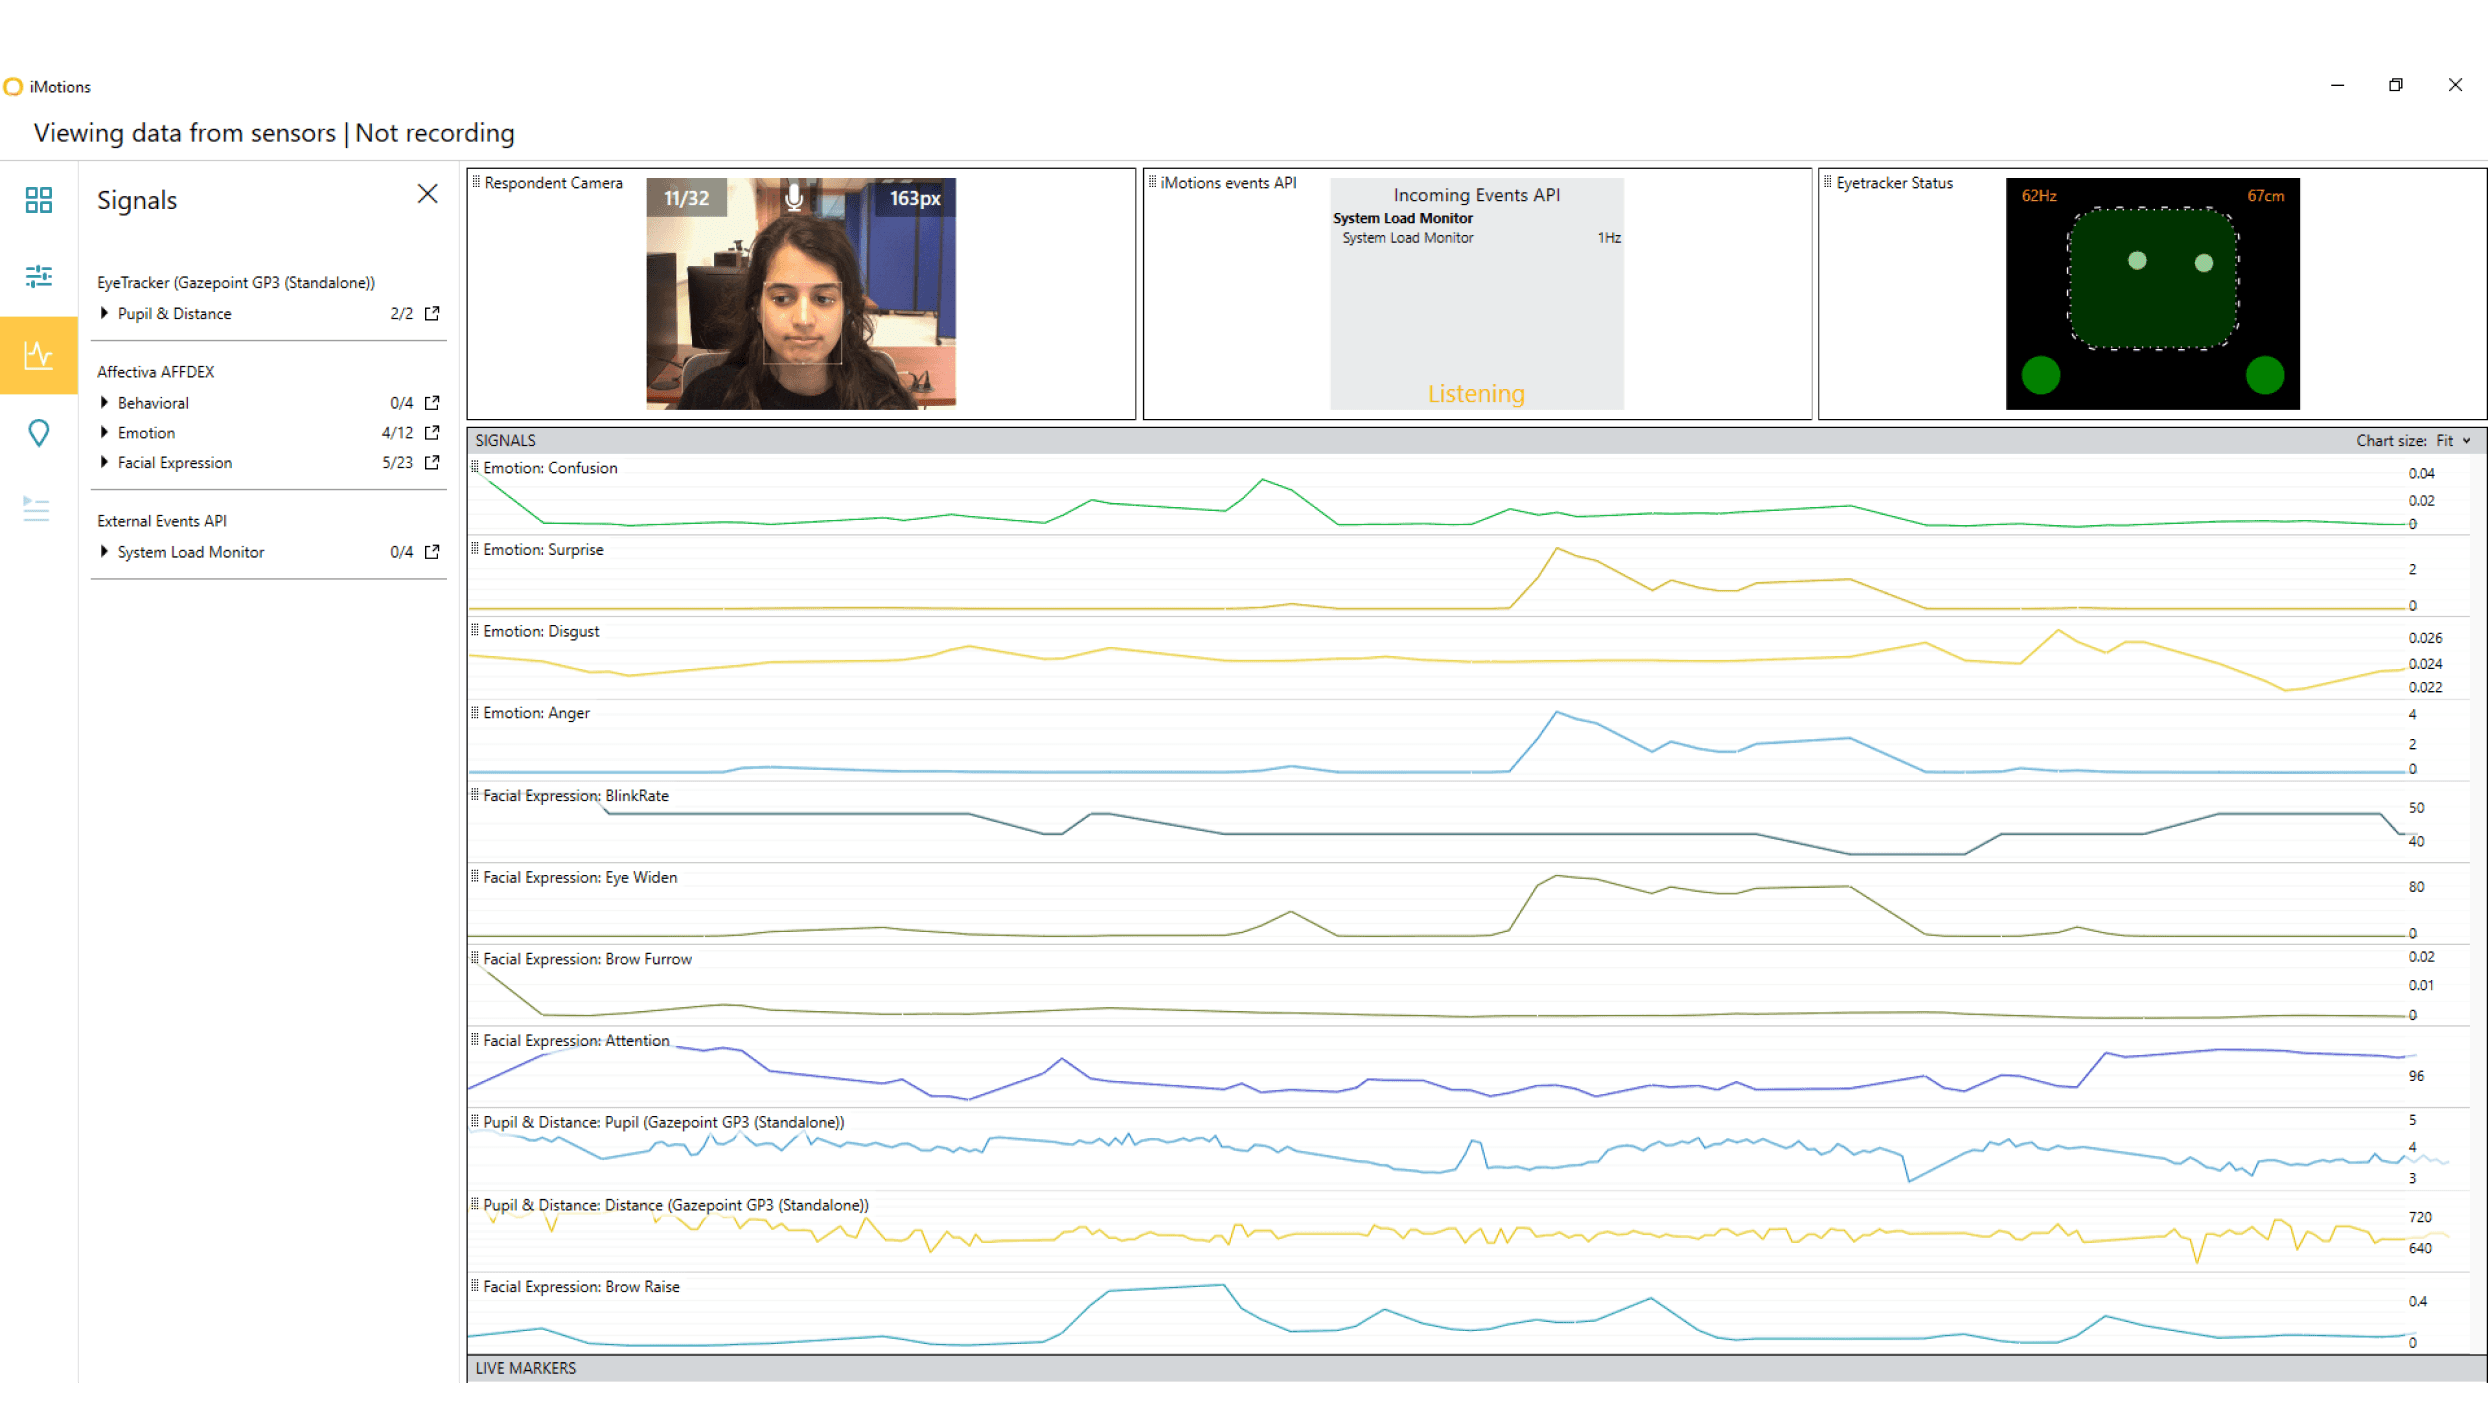
Setup & Apparatus
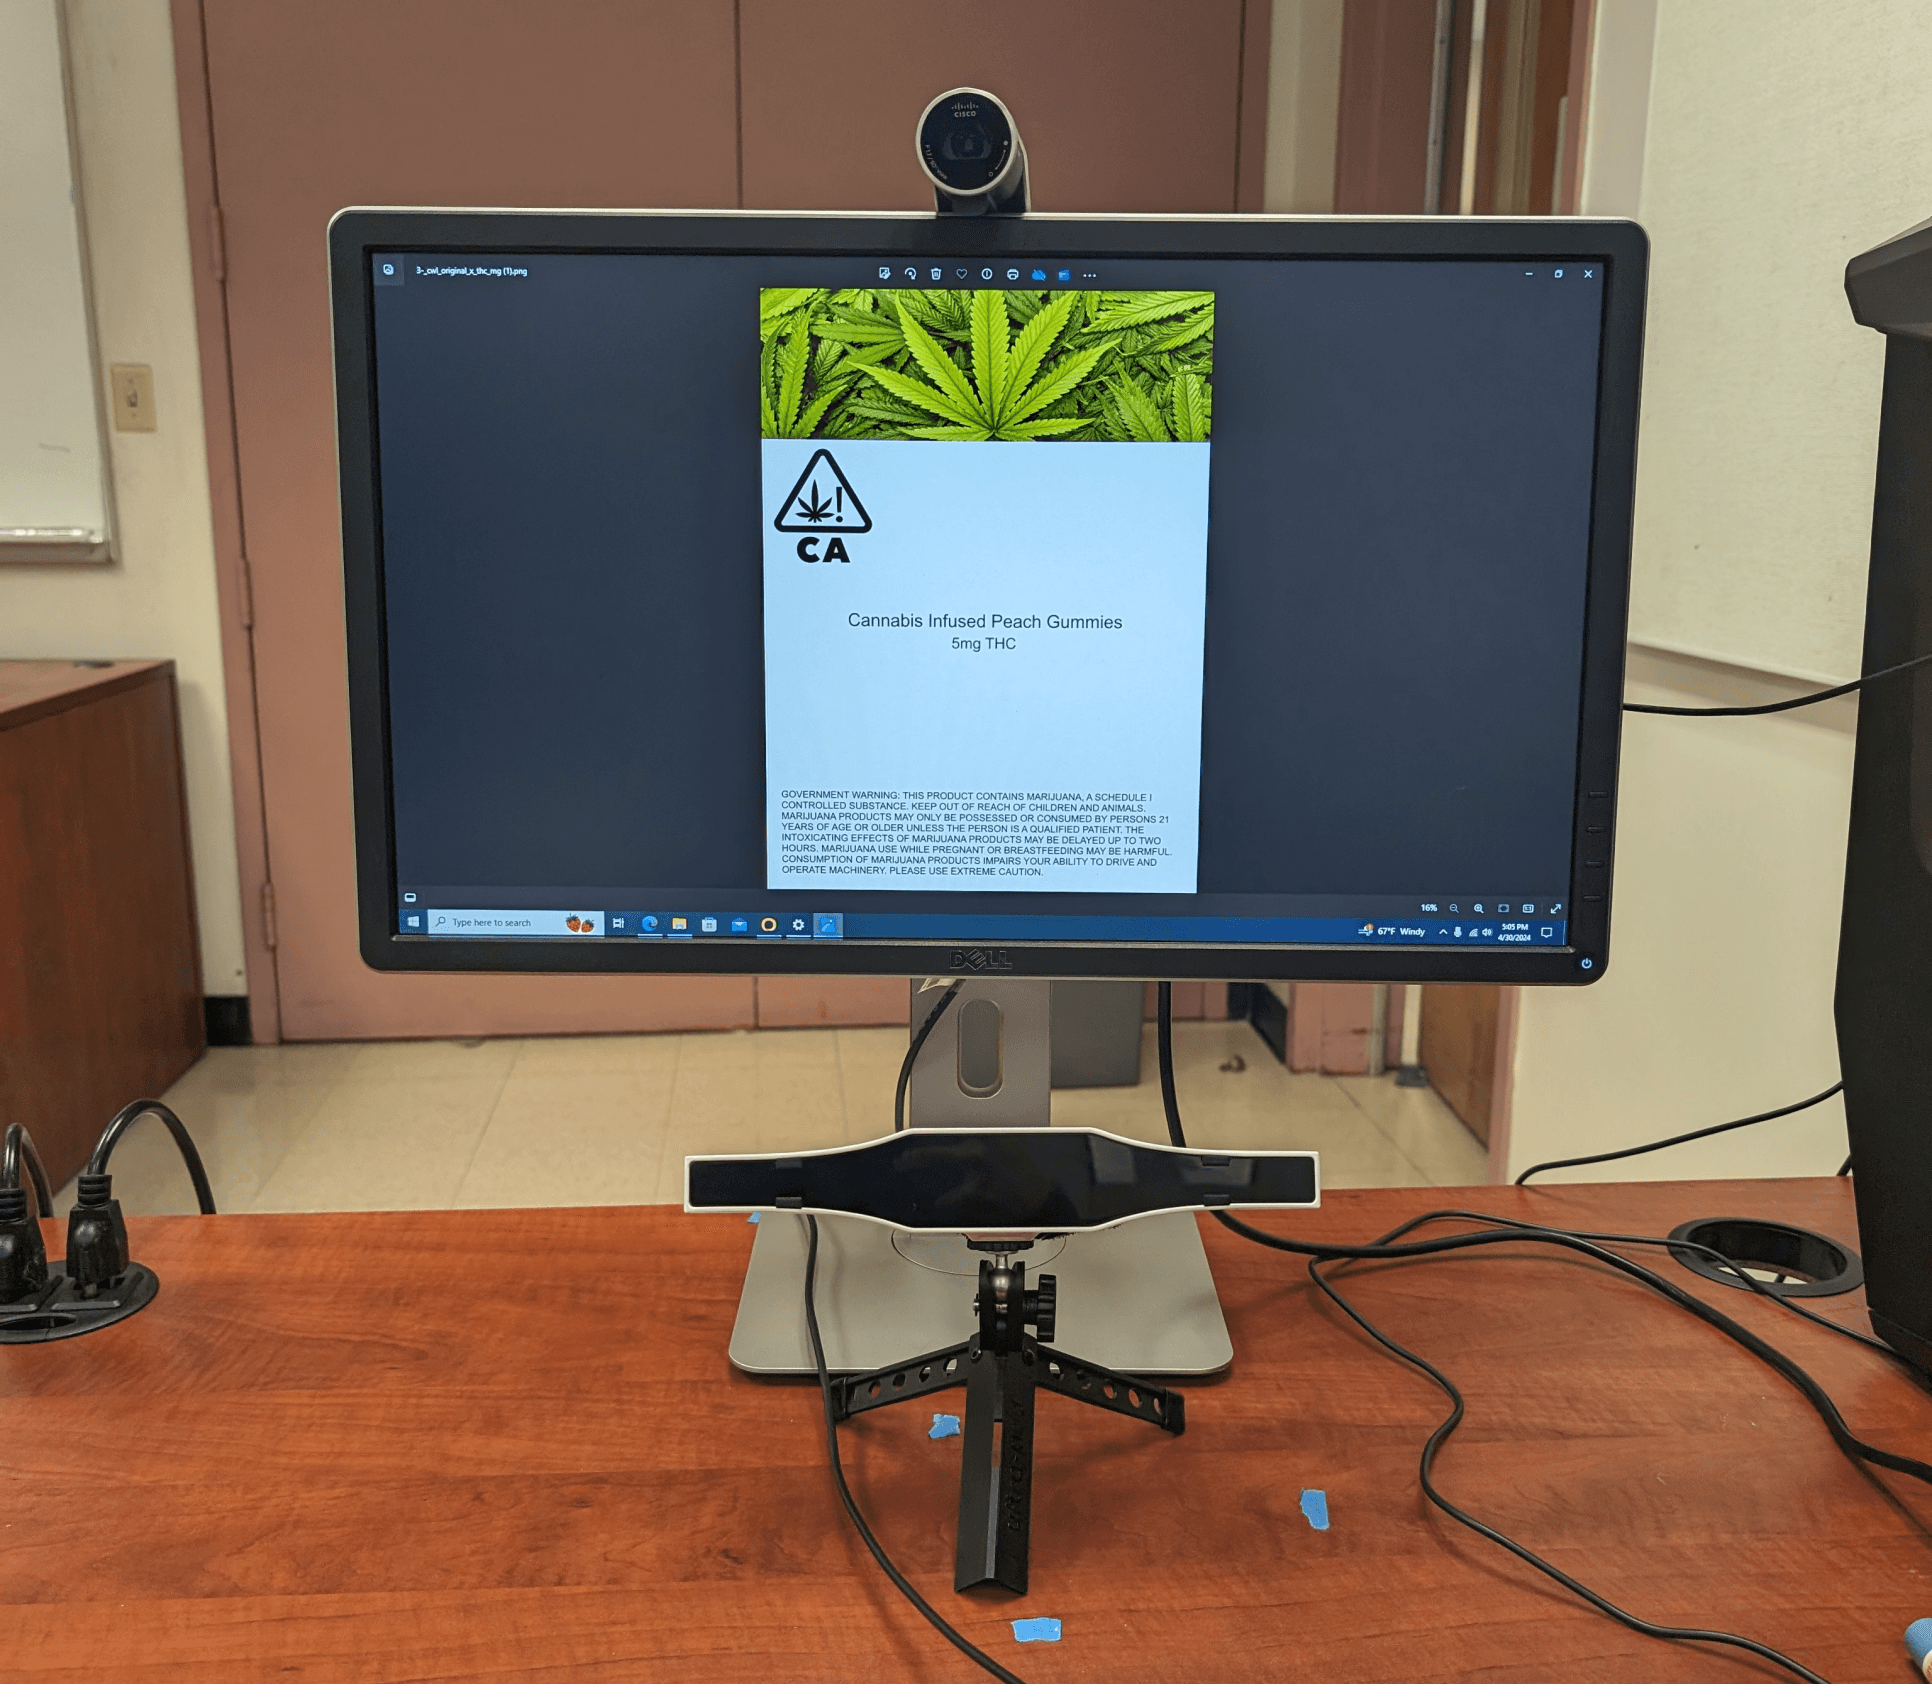
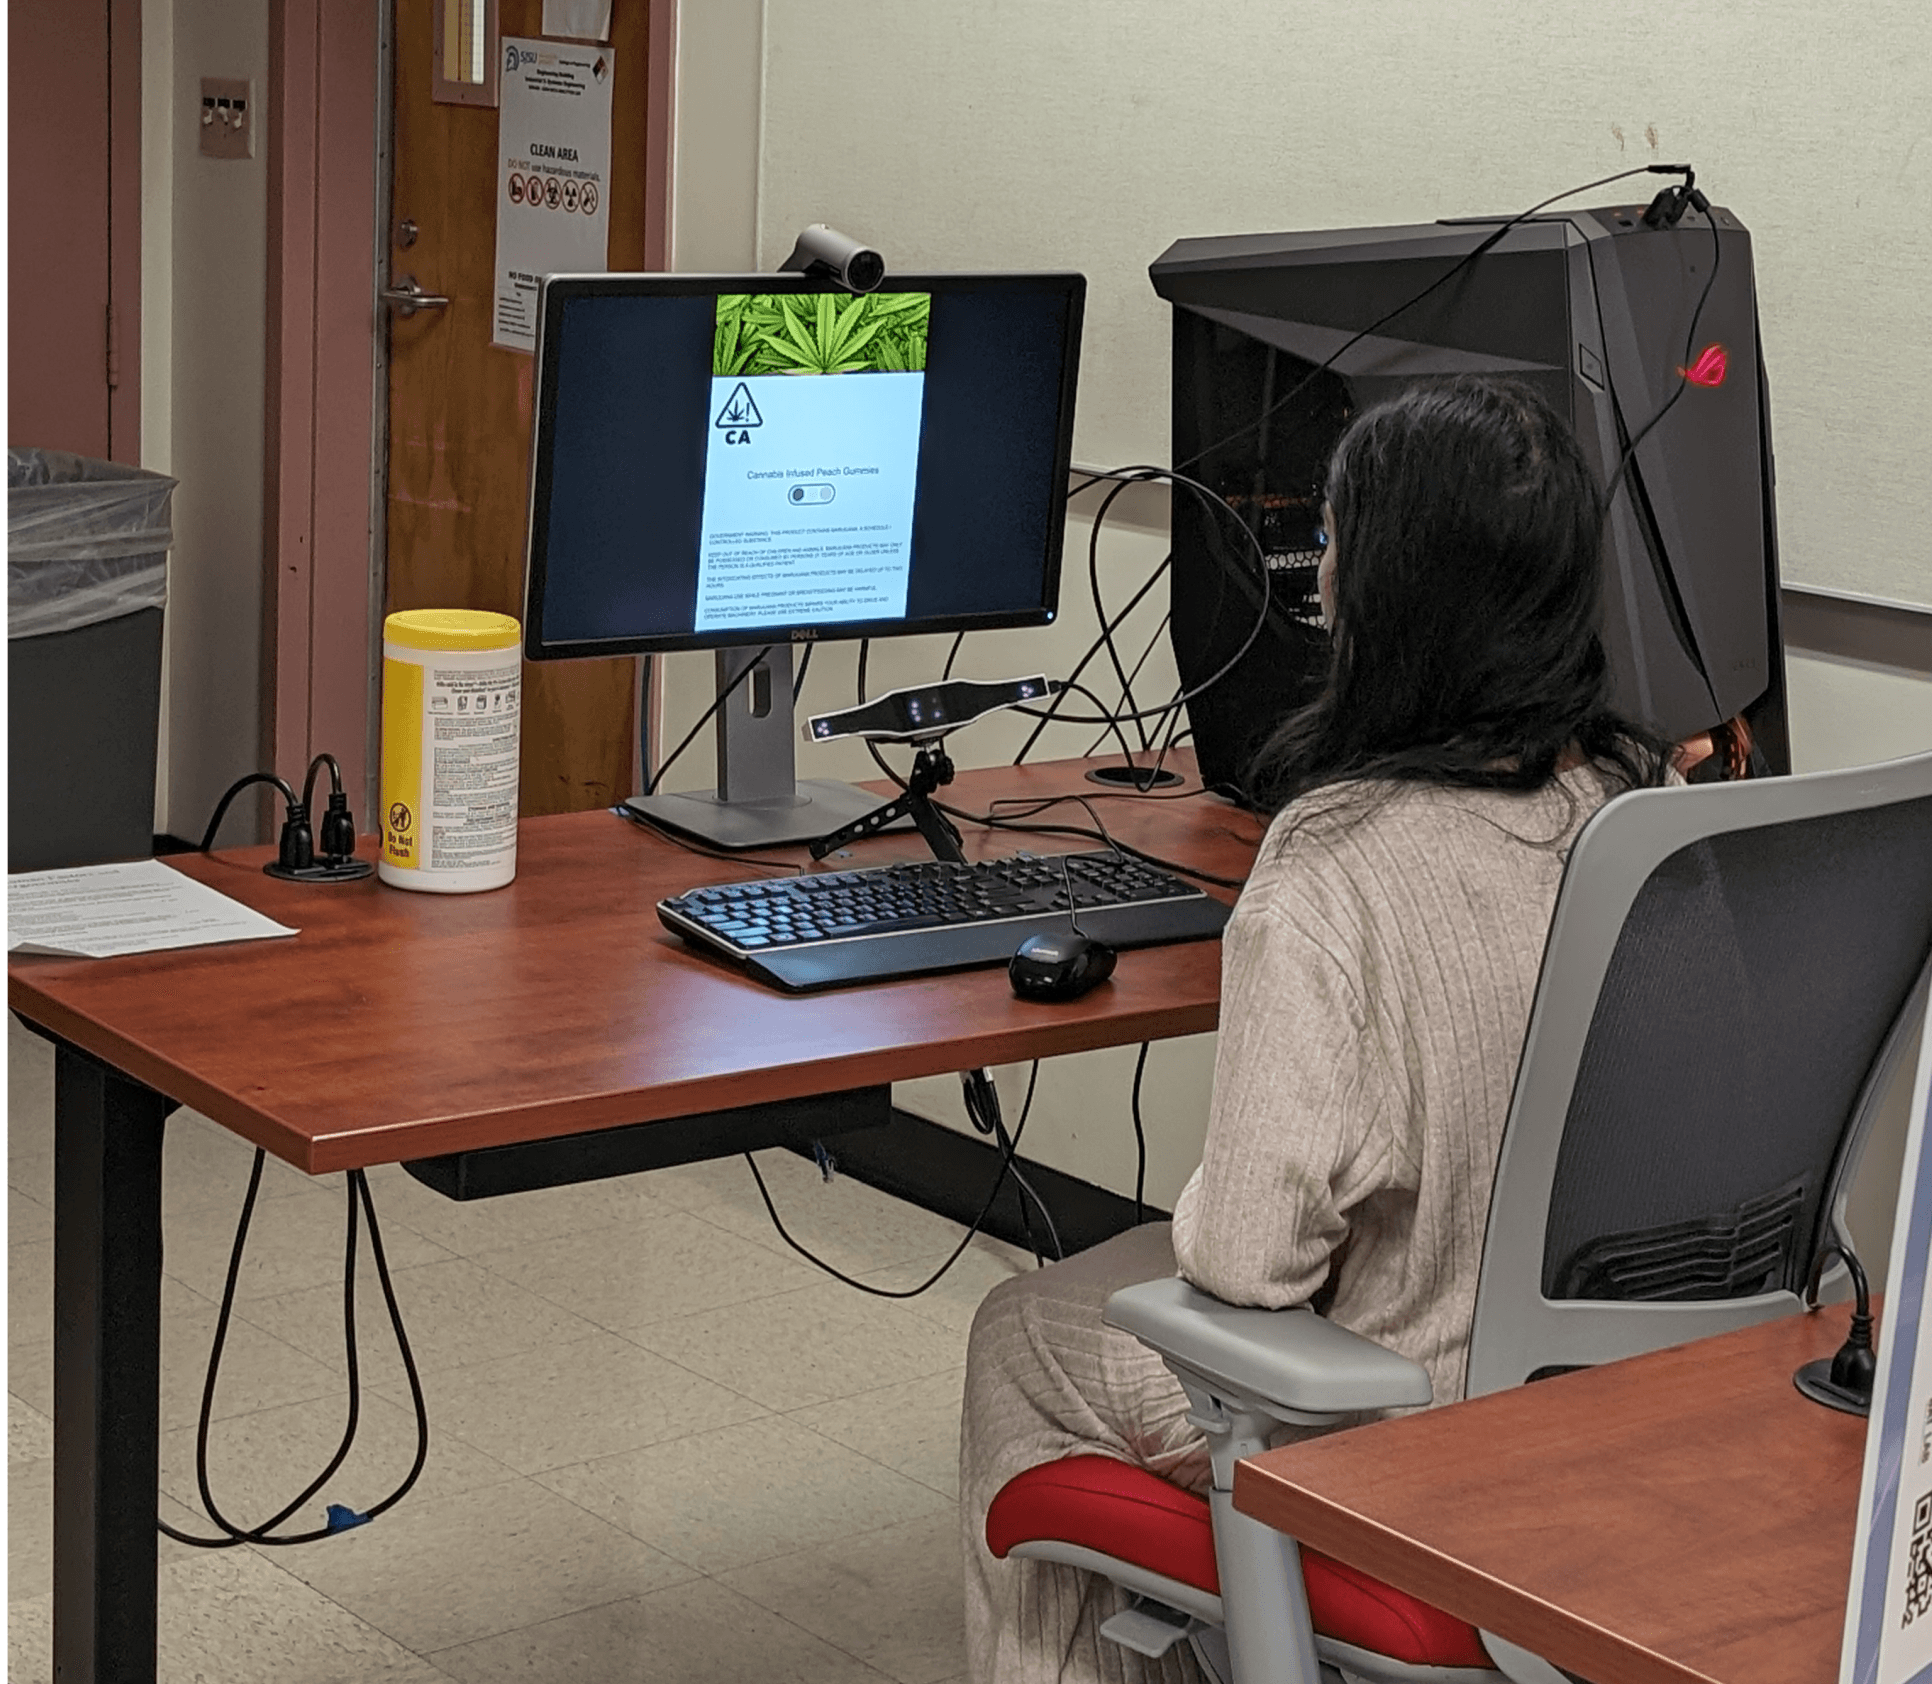
The stimuli images were presented on an 28” monitor with a screen resolution of 1920 x 1980 pixels and a refresh rate of 60 Hz. Eye tracking responses were measured using a Gazepoint GP3HD V2 Eye tracker.
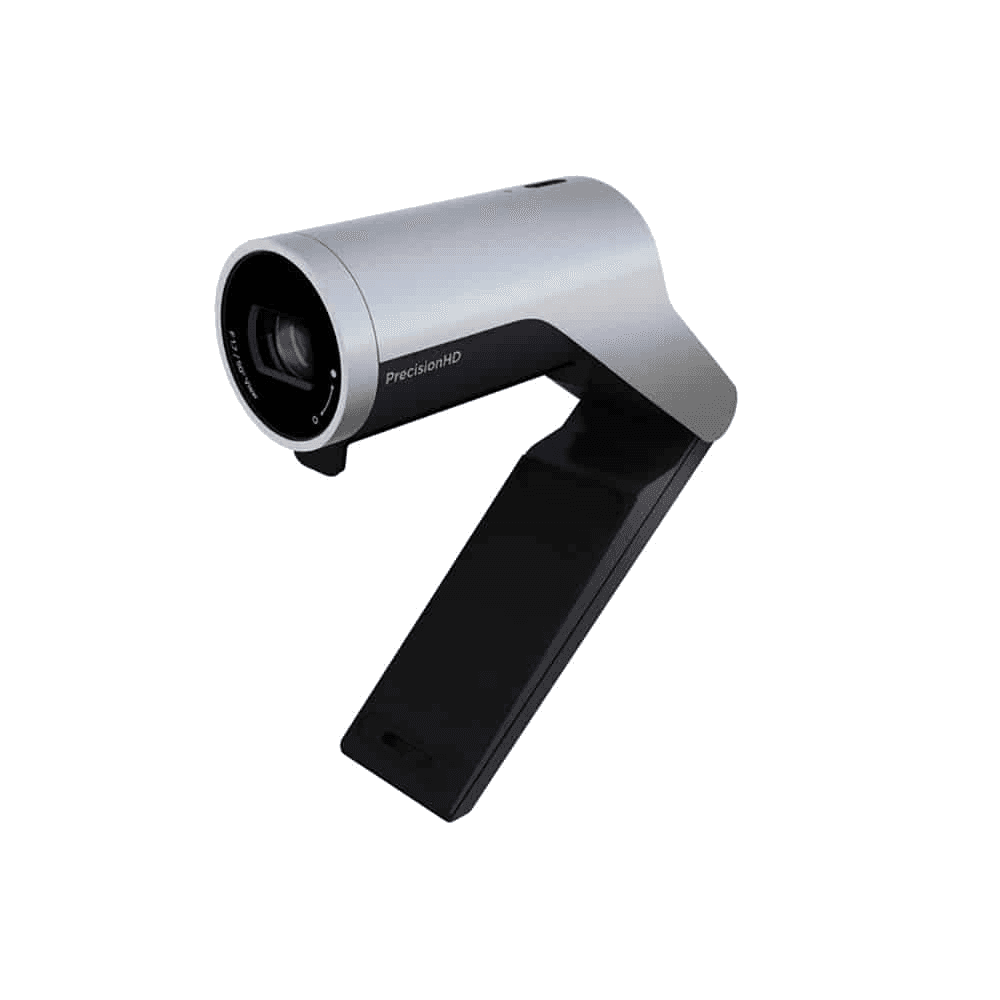
The facial responses were measured using a Cisco Precision HD F1.7/50 Degree View Camera. iMotions eye tracking software was used to present and record the eye-movement.
Eye Tracking and Facial Expression Analysis were two objective measures used in the study.
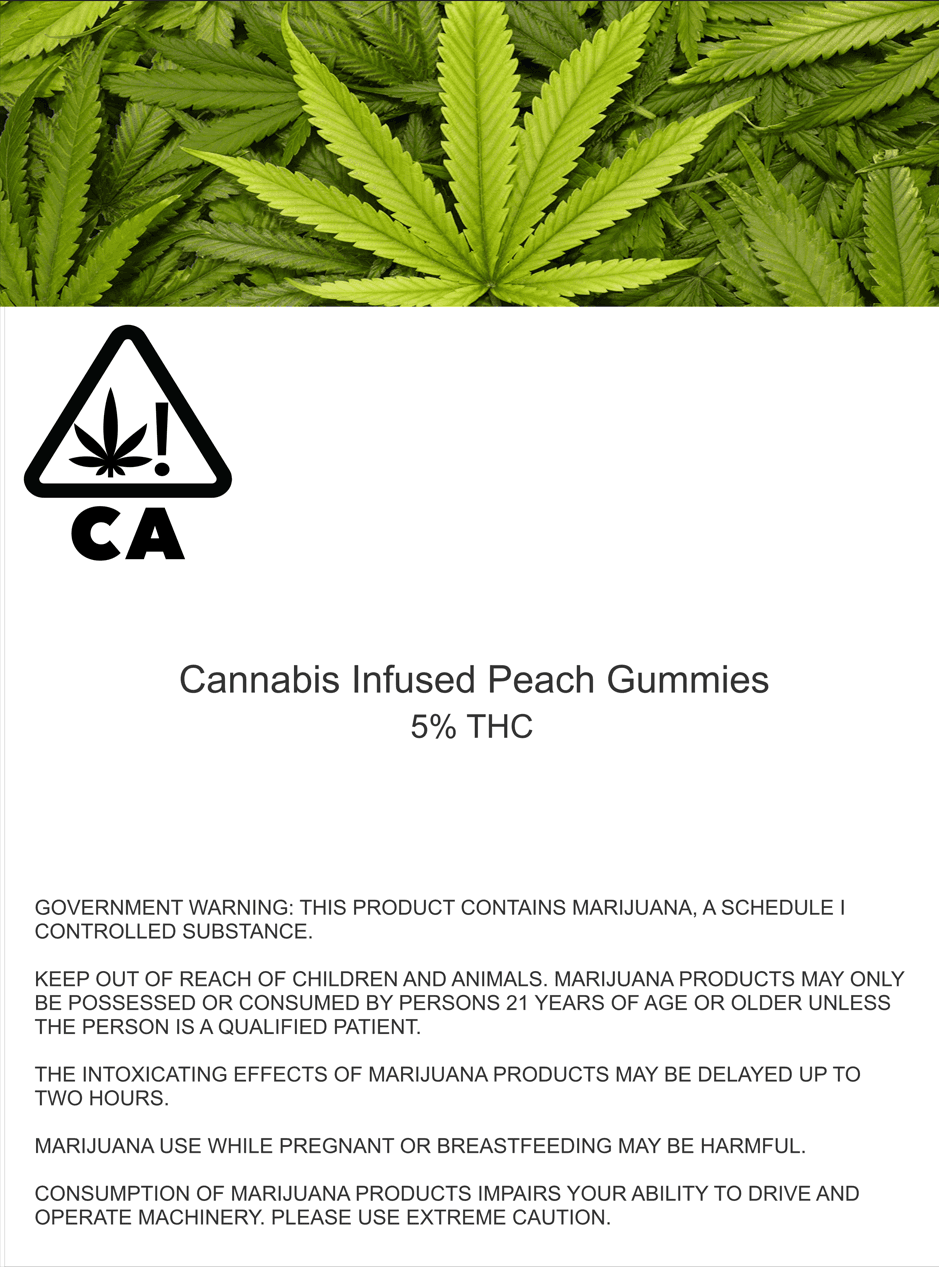
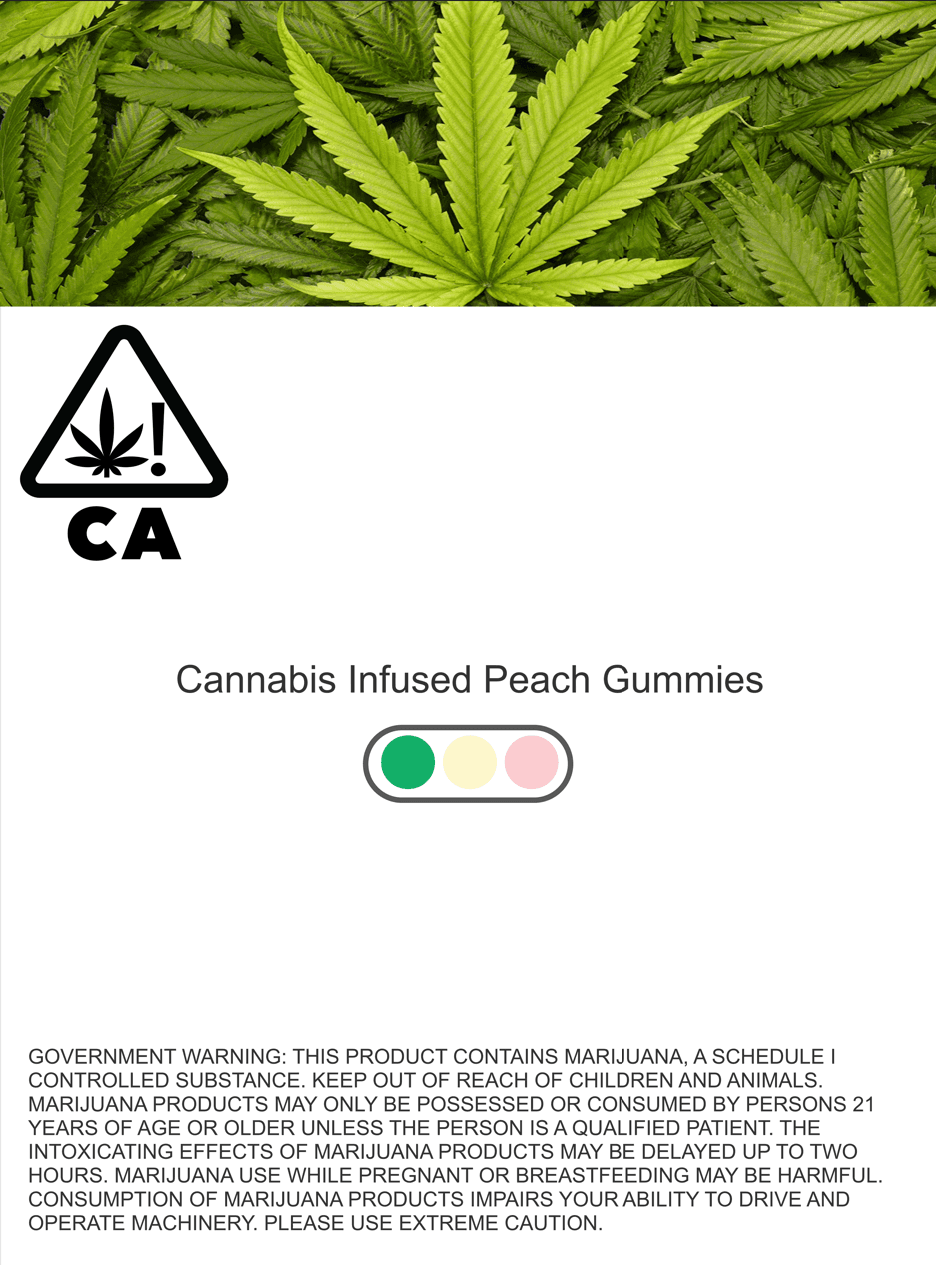
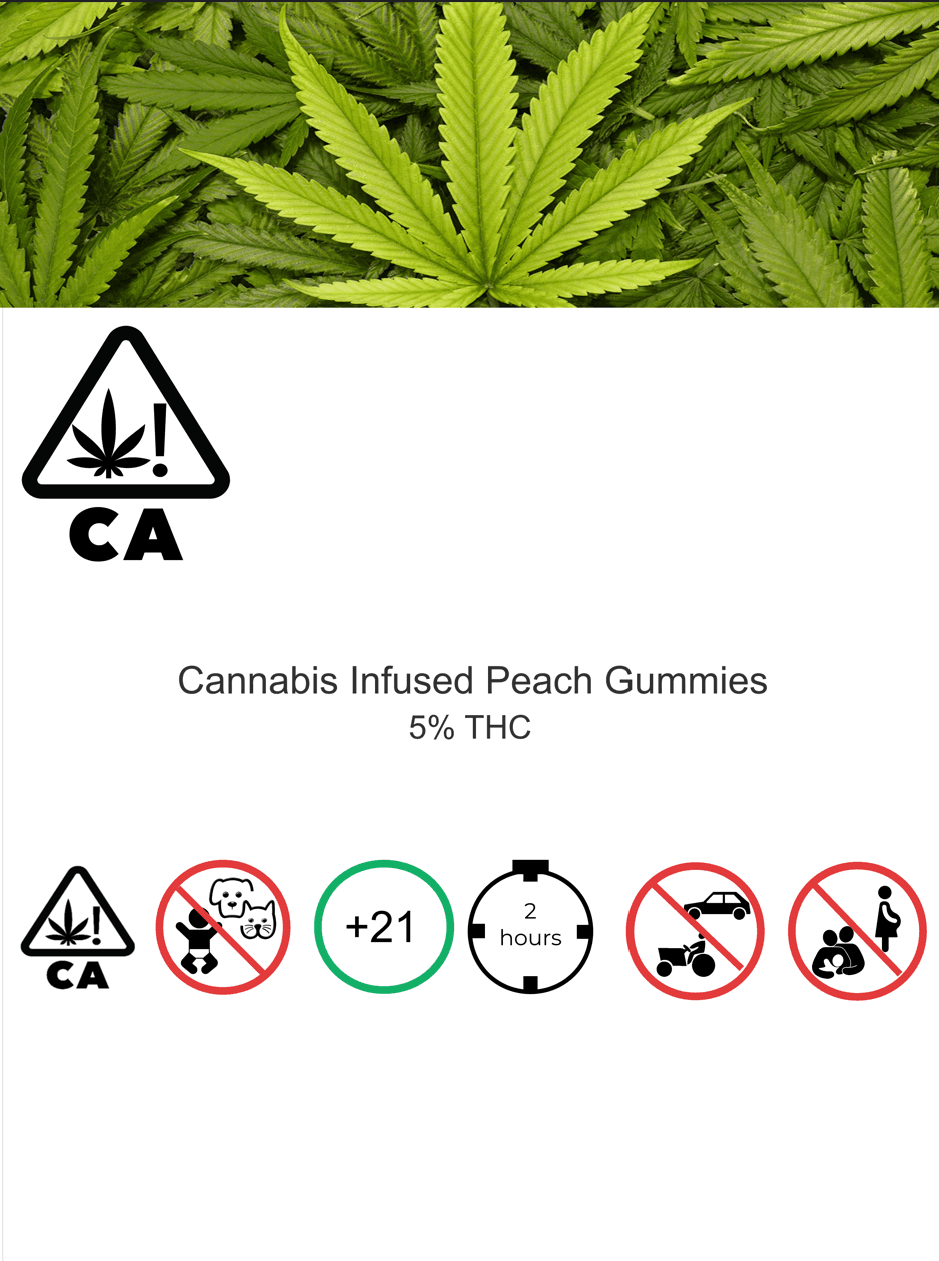
Examples of sample Cannabis Package labels viewed by participants in both Phase 1 and Phase 2.
Phase 2: Comprehension Accuracy Test
Phase 2 of the study was a 3 x 3 x 2 factorial within-subjects full factorial design study where each participant experienced 18 conditions each.
The accuracy of the responses collected from the participants in the quiz section were coded with either a ‘1’ which indicated a correct response or ‘0’ which indicated an incorrect response.
Independent variables:
Cannabis label warning presentation (Original, bullet points, symbols)
Potency presentation (Traffic light, THC %, or MG)
Potency indicated on the label (high or low)
Each image of a label they viewed was followed by two questions:
“Is this a low, medium, or high dose?”
Low
Medium
High
“The Cannabis Government Warning Label (the bottom section of the packaging) is easy to understand”
Strongly Agree
Agree
Neutral
Disagree
Strongly Disagree
This table demonstrates the layout of for this phase of the experiment. There were 9 conditions in total which each participant experienced.
Presentation of Potency Information
Presentation of Cannabis Warning Label
MG
HIGH
HIGH
HIGH
LOW
LOW
LOW
MG x Original
MG x Bullet Points
MG x Symbols
THC % x Original
THC % x Bullet Points
THC % x Symbols
Traffic Light x Original
Traffic Light x Bullet Points
Traffic Light x Symbols
Original
Bullet Points
Symbols
THC %
Traffic Light
Analysis
Facial Expression Processing
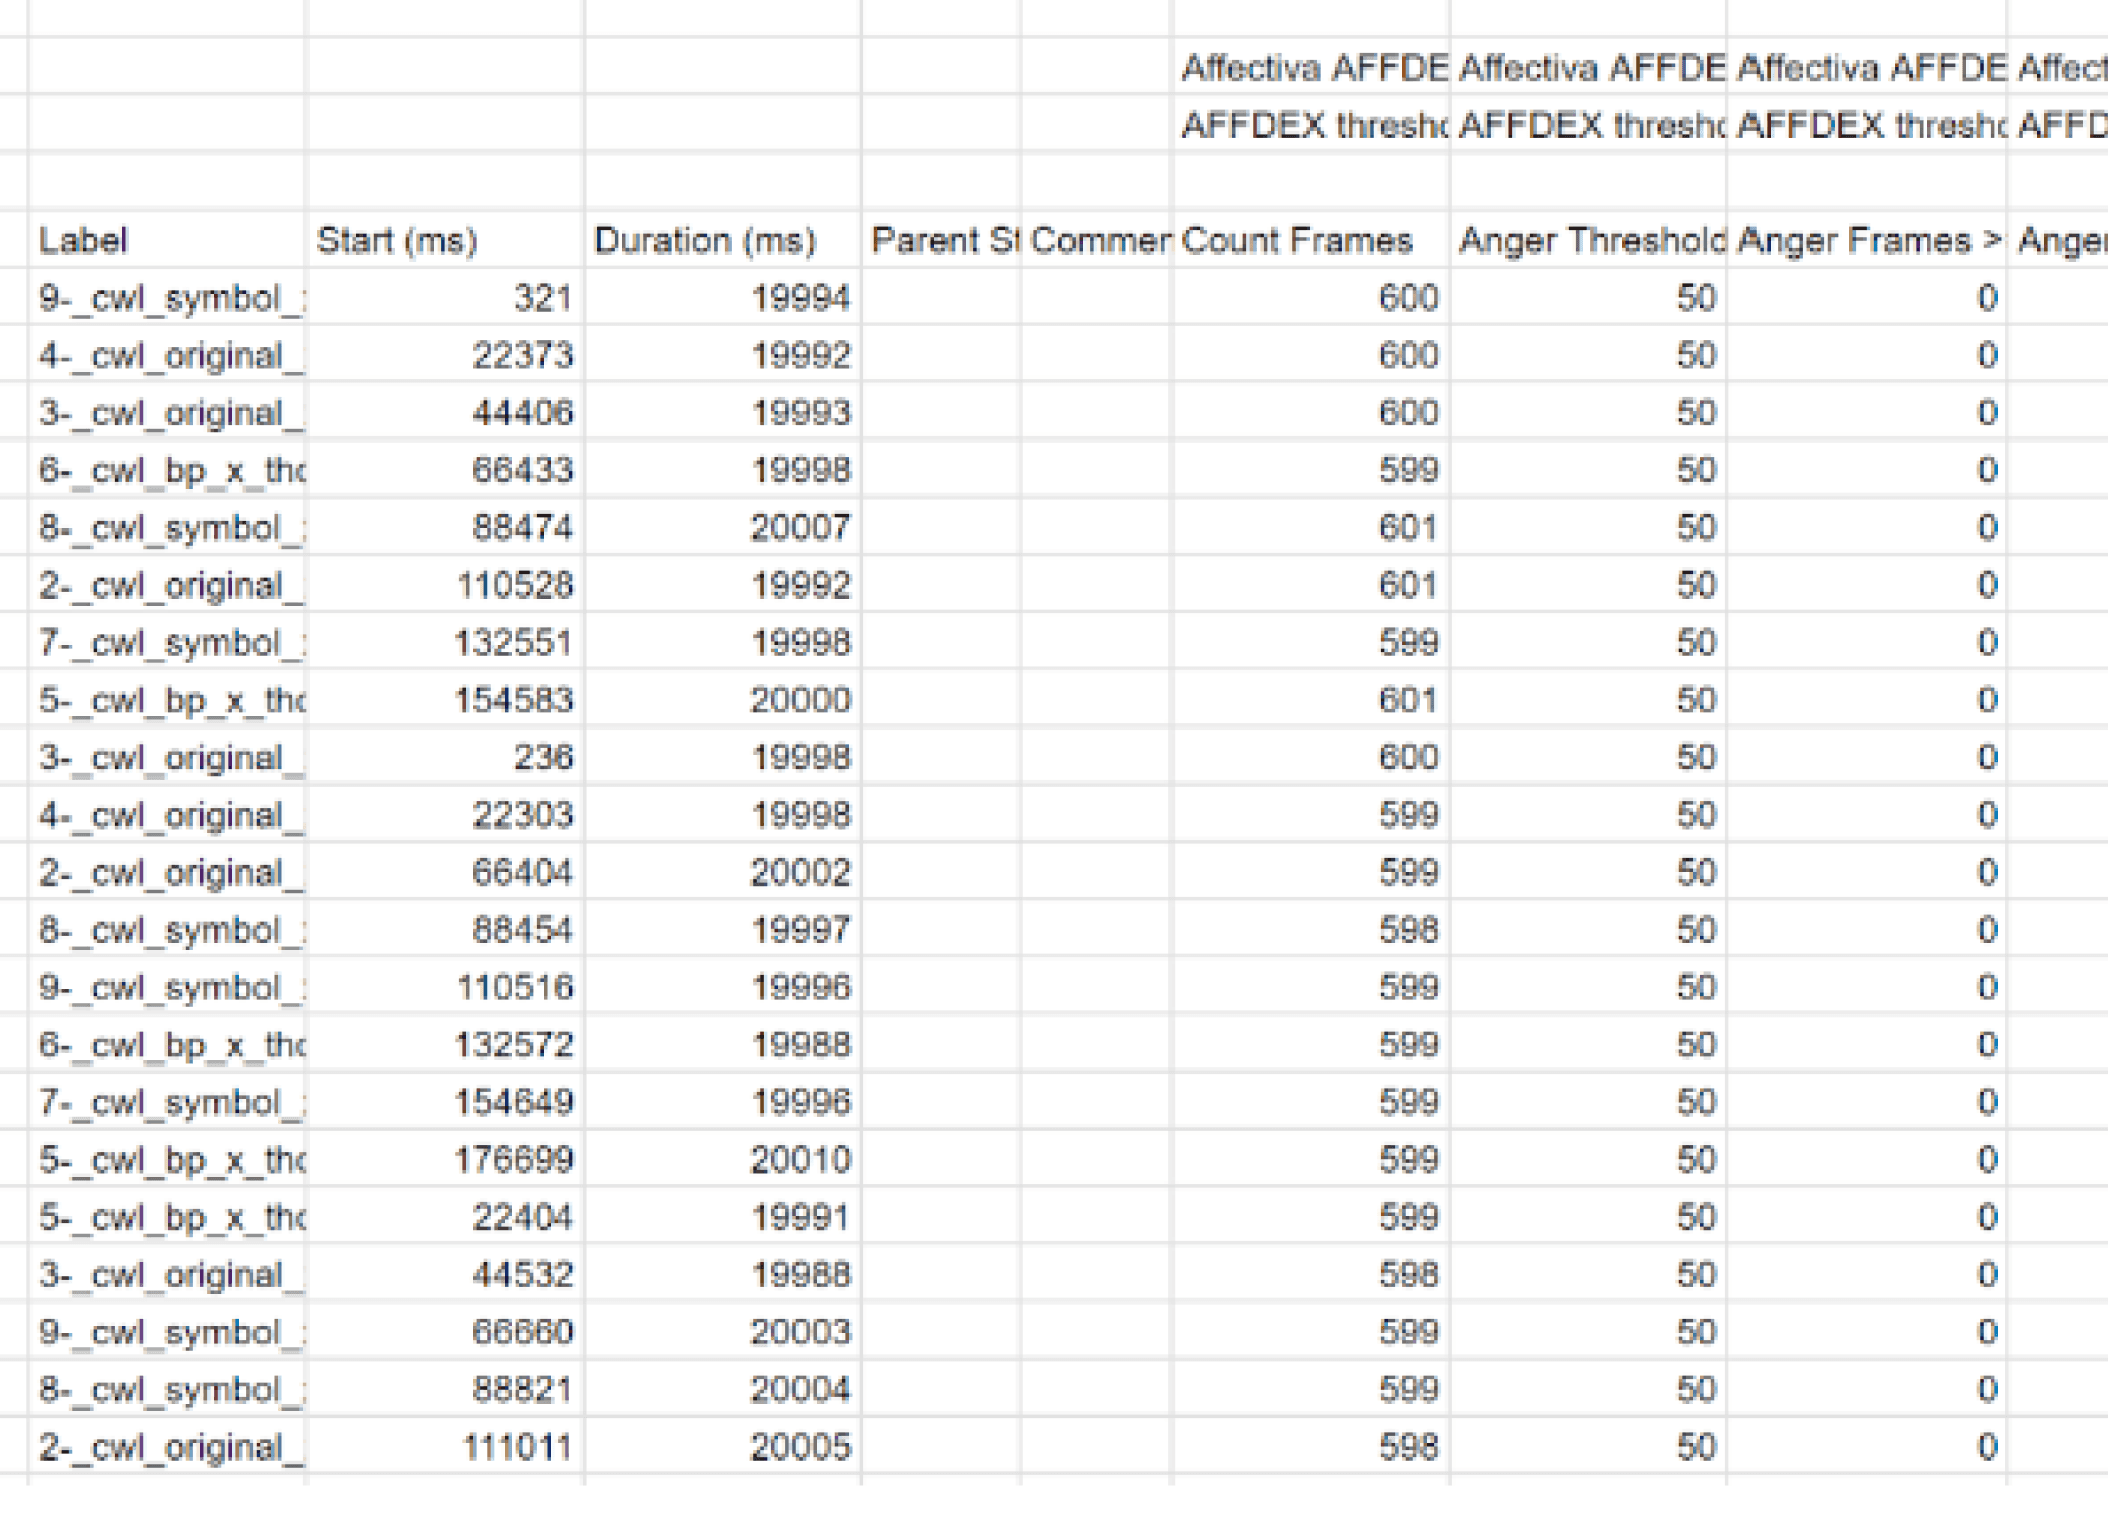
The following emotions and facial expressions were investigated and were flagged for every instance of any of the emotions being detected while participants were looking at the cannabis warning label: confusion, contempt, engagement, negative, brow furrow, inner brow raise, neutral.
Using iMotions, a threshold cutoff of 50 was set for each emotion, if the value ever exceeded 50 the algorithm classified the presentation of an emotion/facial expression.
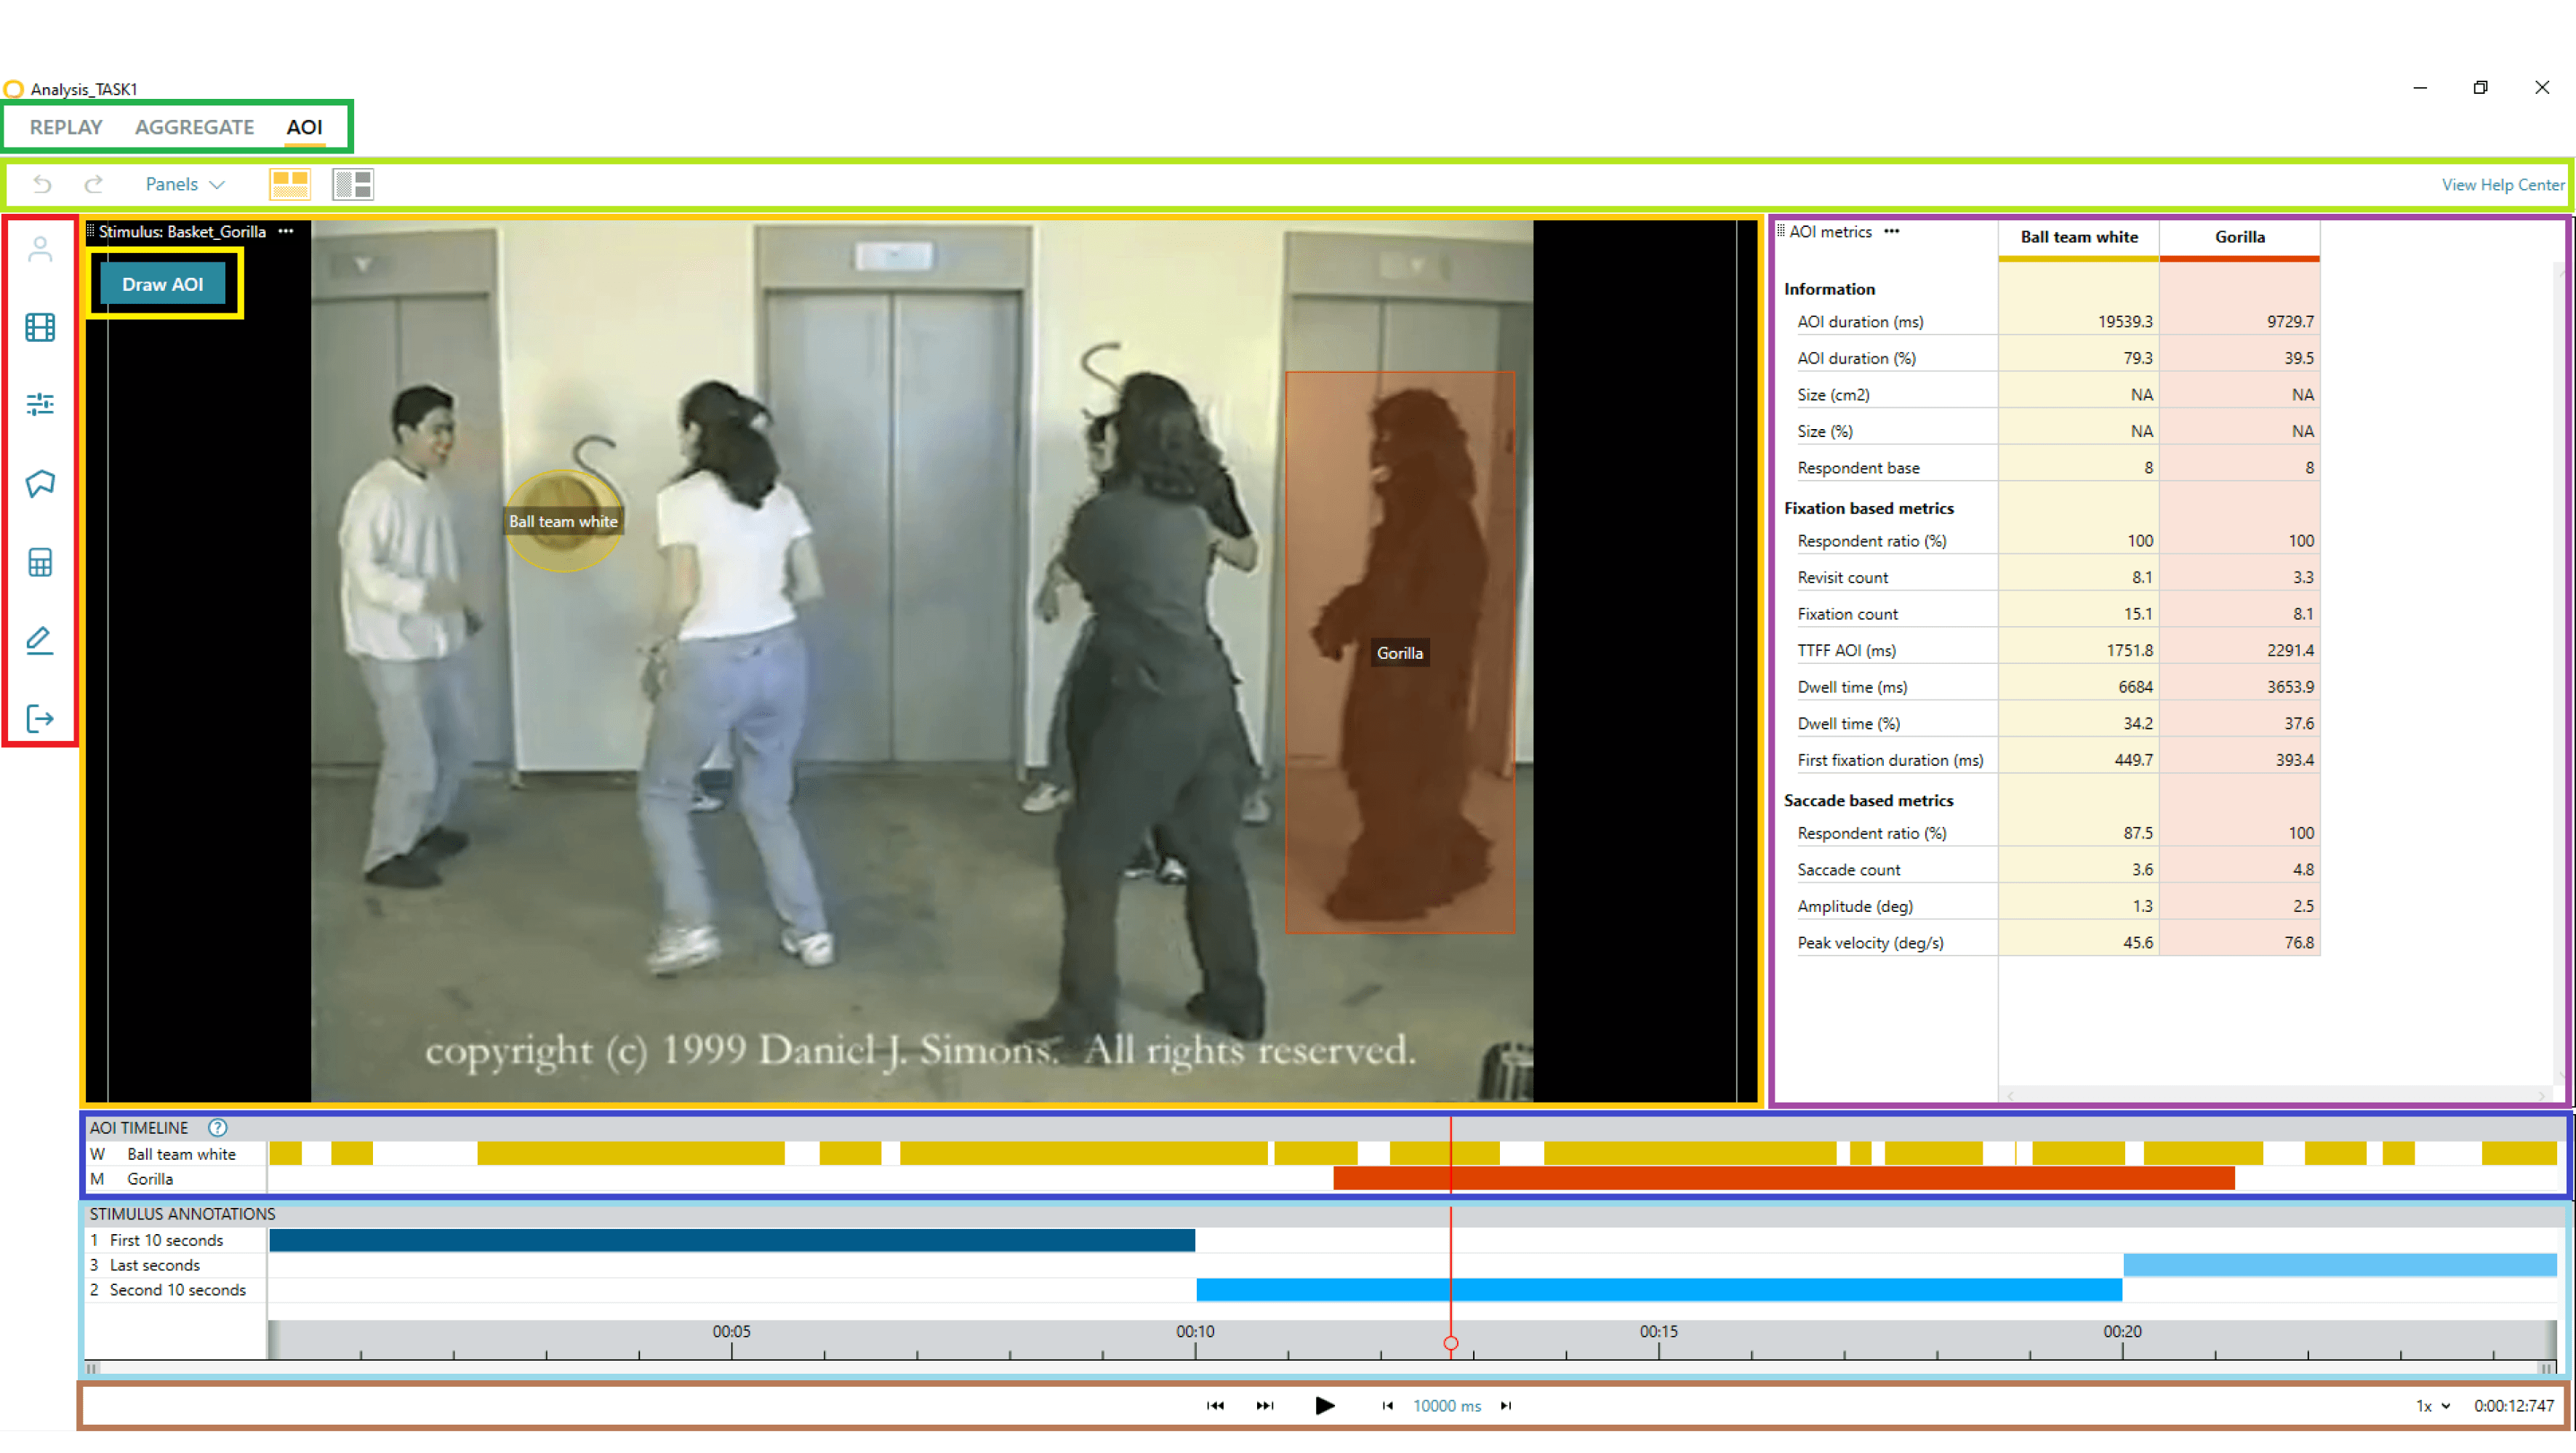
Eye-tracking Analysis
Two separate Areas of Interest (AOI’s) were manually defined by using the iMotions tool to draw a rectangle around the desired area. The AOI’s were defined as the Potency AOI and the CWL AOI.
The following eye-tracking metrics were compared across each of the 9 different conditions for each of the 29 participants for each of the two AOI’s: saccade count, dwell count, average saccade duration, dwell time (fixation %), dwell time (gaze %).
The Eye-tracking metrics were exported via iMotions into an .xls format after which a repeated measures ANOVA was conducted.
Quiz Accuracy
A three way repeated measures ANOVA was performed to compare the effects that different variations of the Potency presentations and the CWL presentations had on participants' accuracy when determining the potency indicated on cannabis labels.
The binary responses were coded whereby a ‘1’ indicated that participants had correctly identified the potency and ‘0’ indicated that they were unable to correctly identify the potency.
CWL Ratings
A repeated measures ANOVA was performed to compare the effects that different variations of the CWL presentations had on participants' subjective ratings of the CWL.
Original
Bullet Points
Symbols
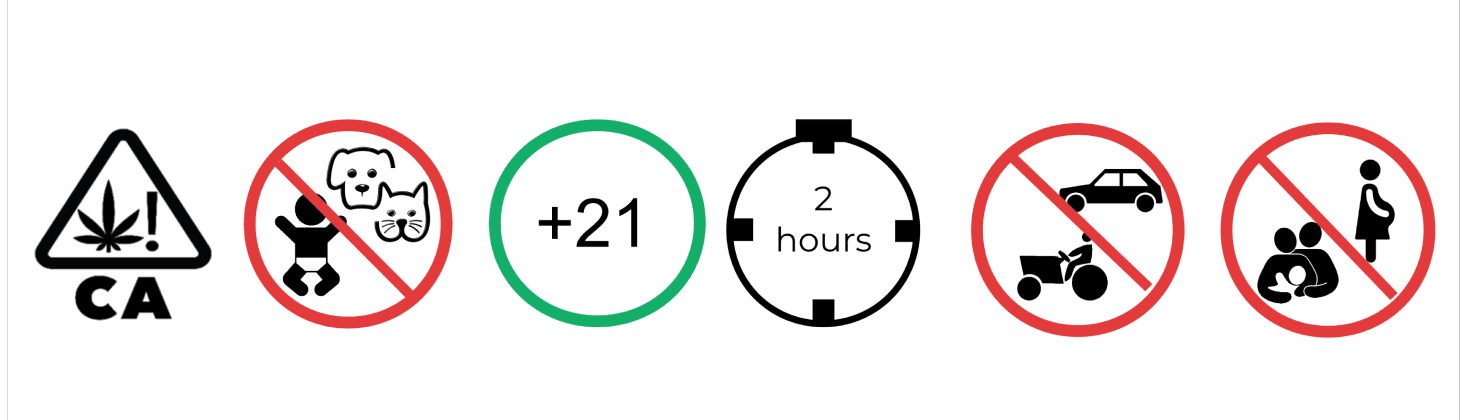
Different presentations of Cannabis Warning Label (CWL) at the bottom of the packaging which were being tested and compared.
Results
For the sake of brevity, I will just be mentioning the X main findings. You can find the link to the entire report at the end of the
case-study.
SUBJECTIVE OPINIONS ON CWL PRESENTATION
Symbols were more visual and easier to see
People wouldn’t have to spend time reading text
Symbols feel easier to understand.
Results
Participant’s Opinions
Symbols can be easily misinterpreted
Novices may not understand what the symbols mean
Symbols feel lazy
Symbols are not not easy to understand
13/24
PREFERRED TEXT
OVER SYMBOL
11/24
PREFERRED SYMBOL
OVER TEXT
“[Symbols are] easier and faster to comprehend instead of having to read everything out. I think others would agree with me because most of the time we consume cannabis, we don't often look at the warning labels. Having symbols/signs on the warning labels encourages me to actually look at them more.”
People were most used to identifying THC
potency using MG.
Traffic light notation is a subjective grading system - high potency for one person could be another person’s low potency.
Participants found it difficult to understand
THC%.
14/24
PREFERRED MG
5/24
PREFERRED THC%
5/24
PREFERRED TRAFFIC LIGHT
SUBJECTIVE OPINIONS ON POTENCY PRESENTATION


Different presentations of Cannabis Warning Label (CWL) at the bottom of the packaging which were being tested and compared.
MG
Traffic Light
THC %
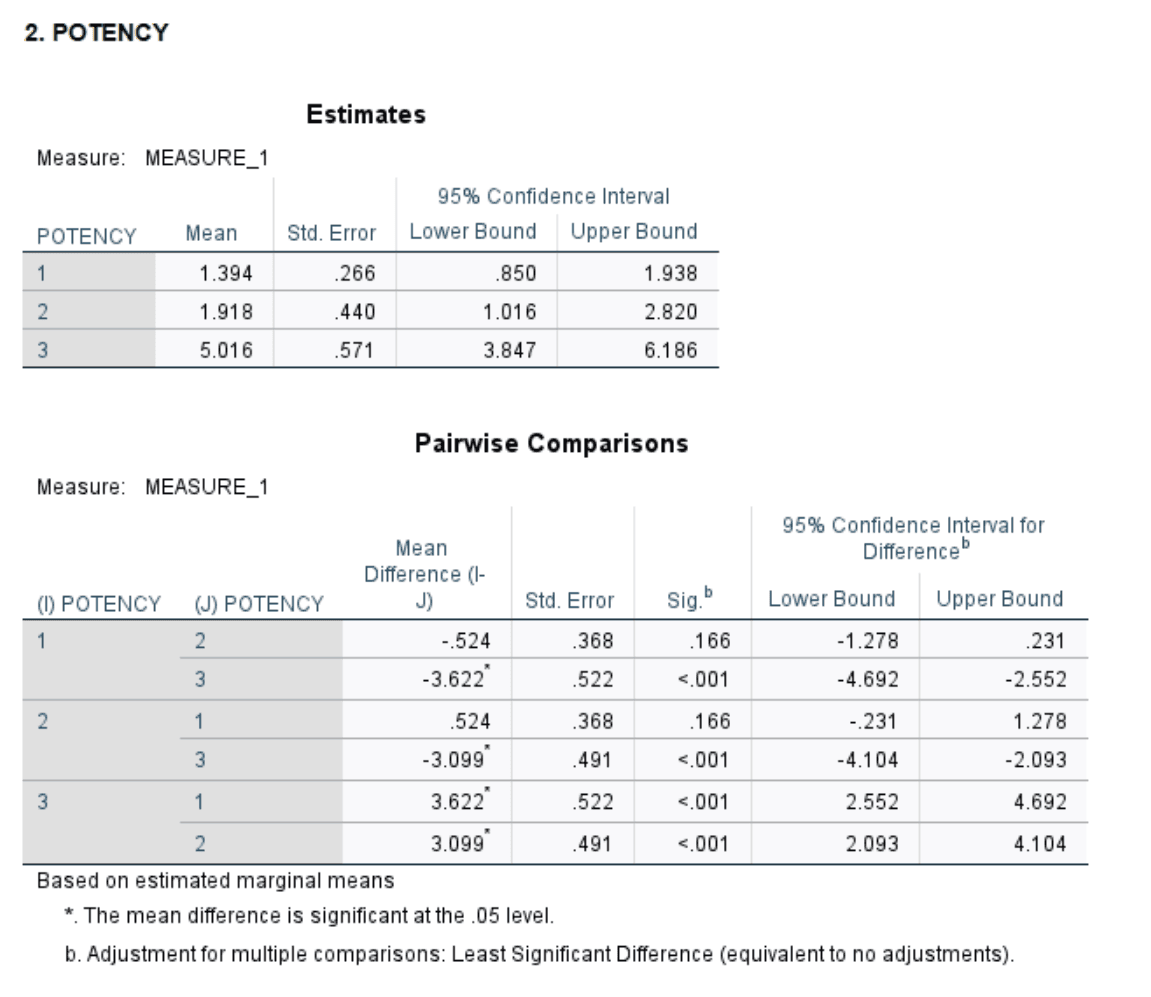
POTENCY PRESENTATION
The comprehension phase of the study demonstrated that presentation styles can have an effect on the way cannabis users interpret potency.
Participants were more accurate when judging potencies when the potency was shown with a Traffic light presentation compared to when it was shown with the THC %.
This is an important finding as current California requirements ask potencies to be indicated in THC % which was least preferred by participants alongside the symbol representation.
CWL PRESENTATION
Participants preferred the Bullet Point presentation significantly more than both the Original Presentation and the Symbol presentation.
This is another important finding as current California cannabis label requirements involve displaying the Cannabis Warning Label as a paragraph (the Original condition) which participants felt was difficult to read and made it less likely for them to want to read it.
Making a warning label that includes pertinent information regarding cannabis consumption more salient and easy readable and accessible is vital and is something that policy makers need to prioritize in order to help decrease the negative risks that are associated with cannabis consumption.
Although this study may not be able to definitively suggest an ideal set of requirements
for cannabis labels, it hopes to at least open up the discussion into conducting more studies and
delving deeper into this area of research to better understand how to best represent important
potency and warning label information that will encourage consumers to notice and understand
important information to allow for safe cannabis consumption.
Final Thoughts
Full Study
Thank you for reading through this case-study, I was very proud and excited to have been able to learn more about the way people would interpret information presented in different formats when it came to cannabis labels.
If you are interested in seeing the complete study, please click HERE.