Setup & Apparatus
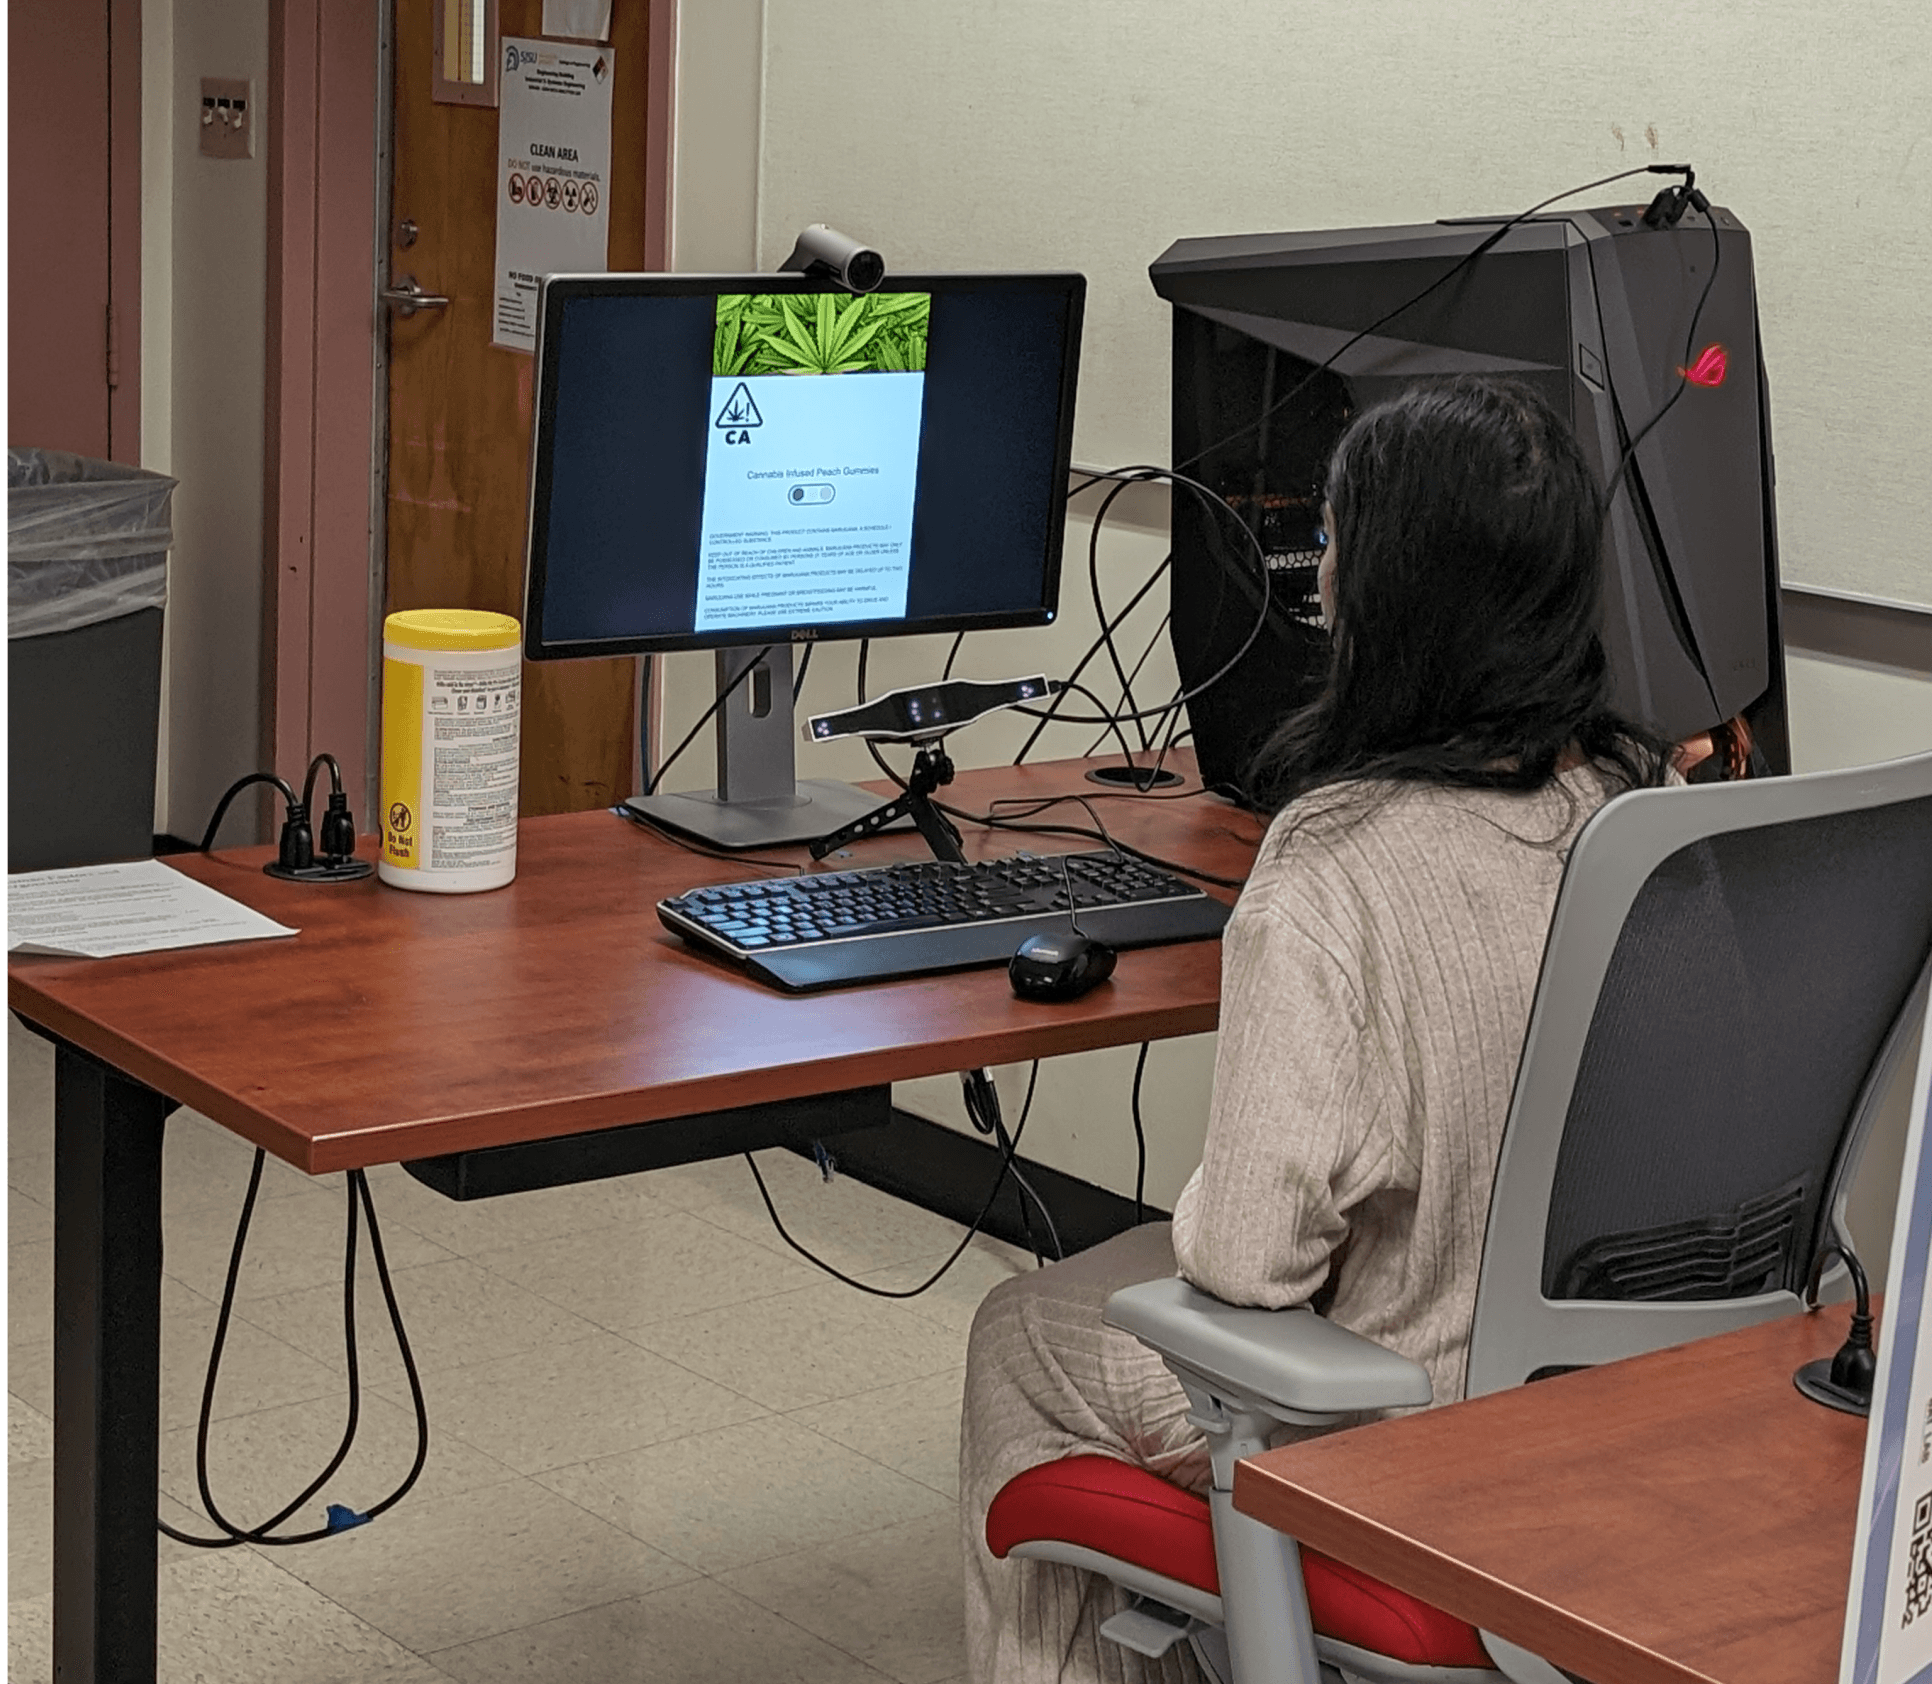
The stimuli images were presented on an 28” monitor with a screen resolution of 1920 x 1980 pixels and a refresh rate of 60 Hz. Eye tracking responses were measured using a Gazepoint GP3HD V2 Eye tracker.
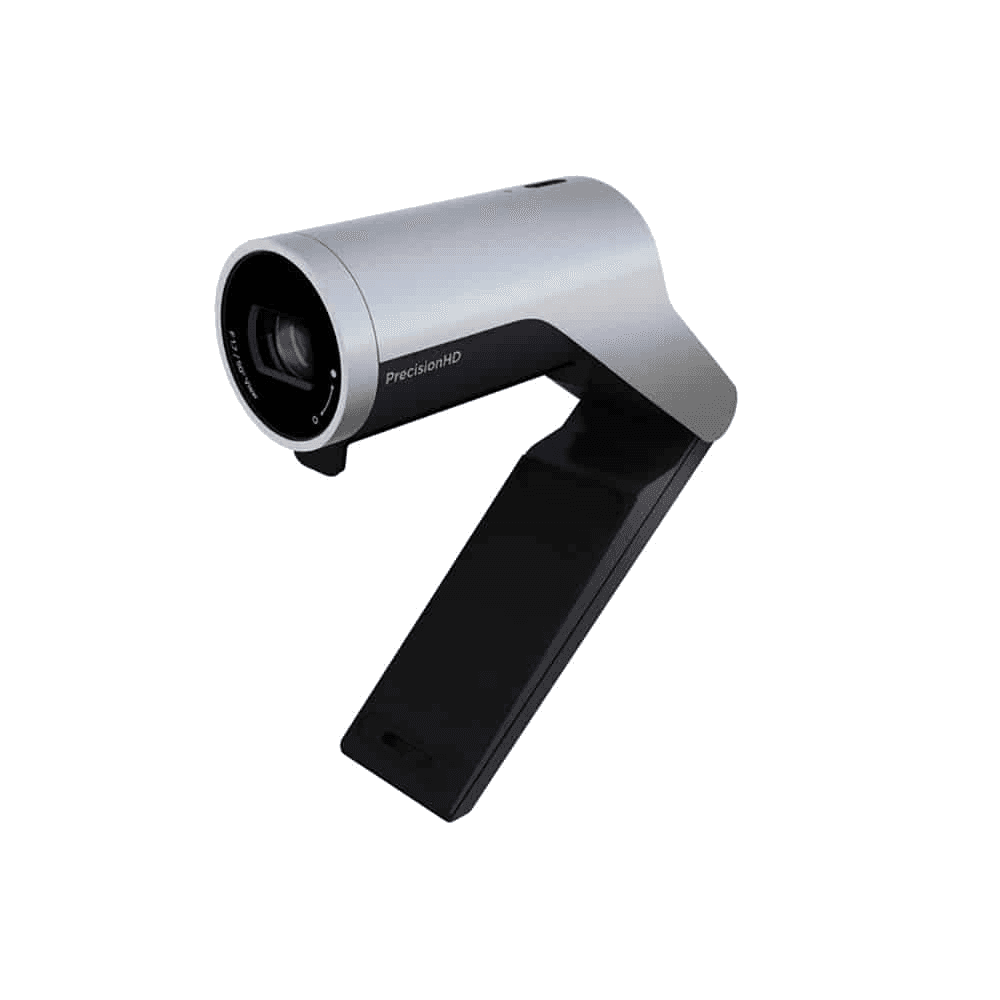
The facial responses were measured using a Cisco Precision HD F1.7/50 Degree View Camera. iMotions eye tracking software was used to present and record the eye-movement.
Eye Tracking and Facial Expression Analysis were two objective measures used in the study.
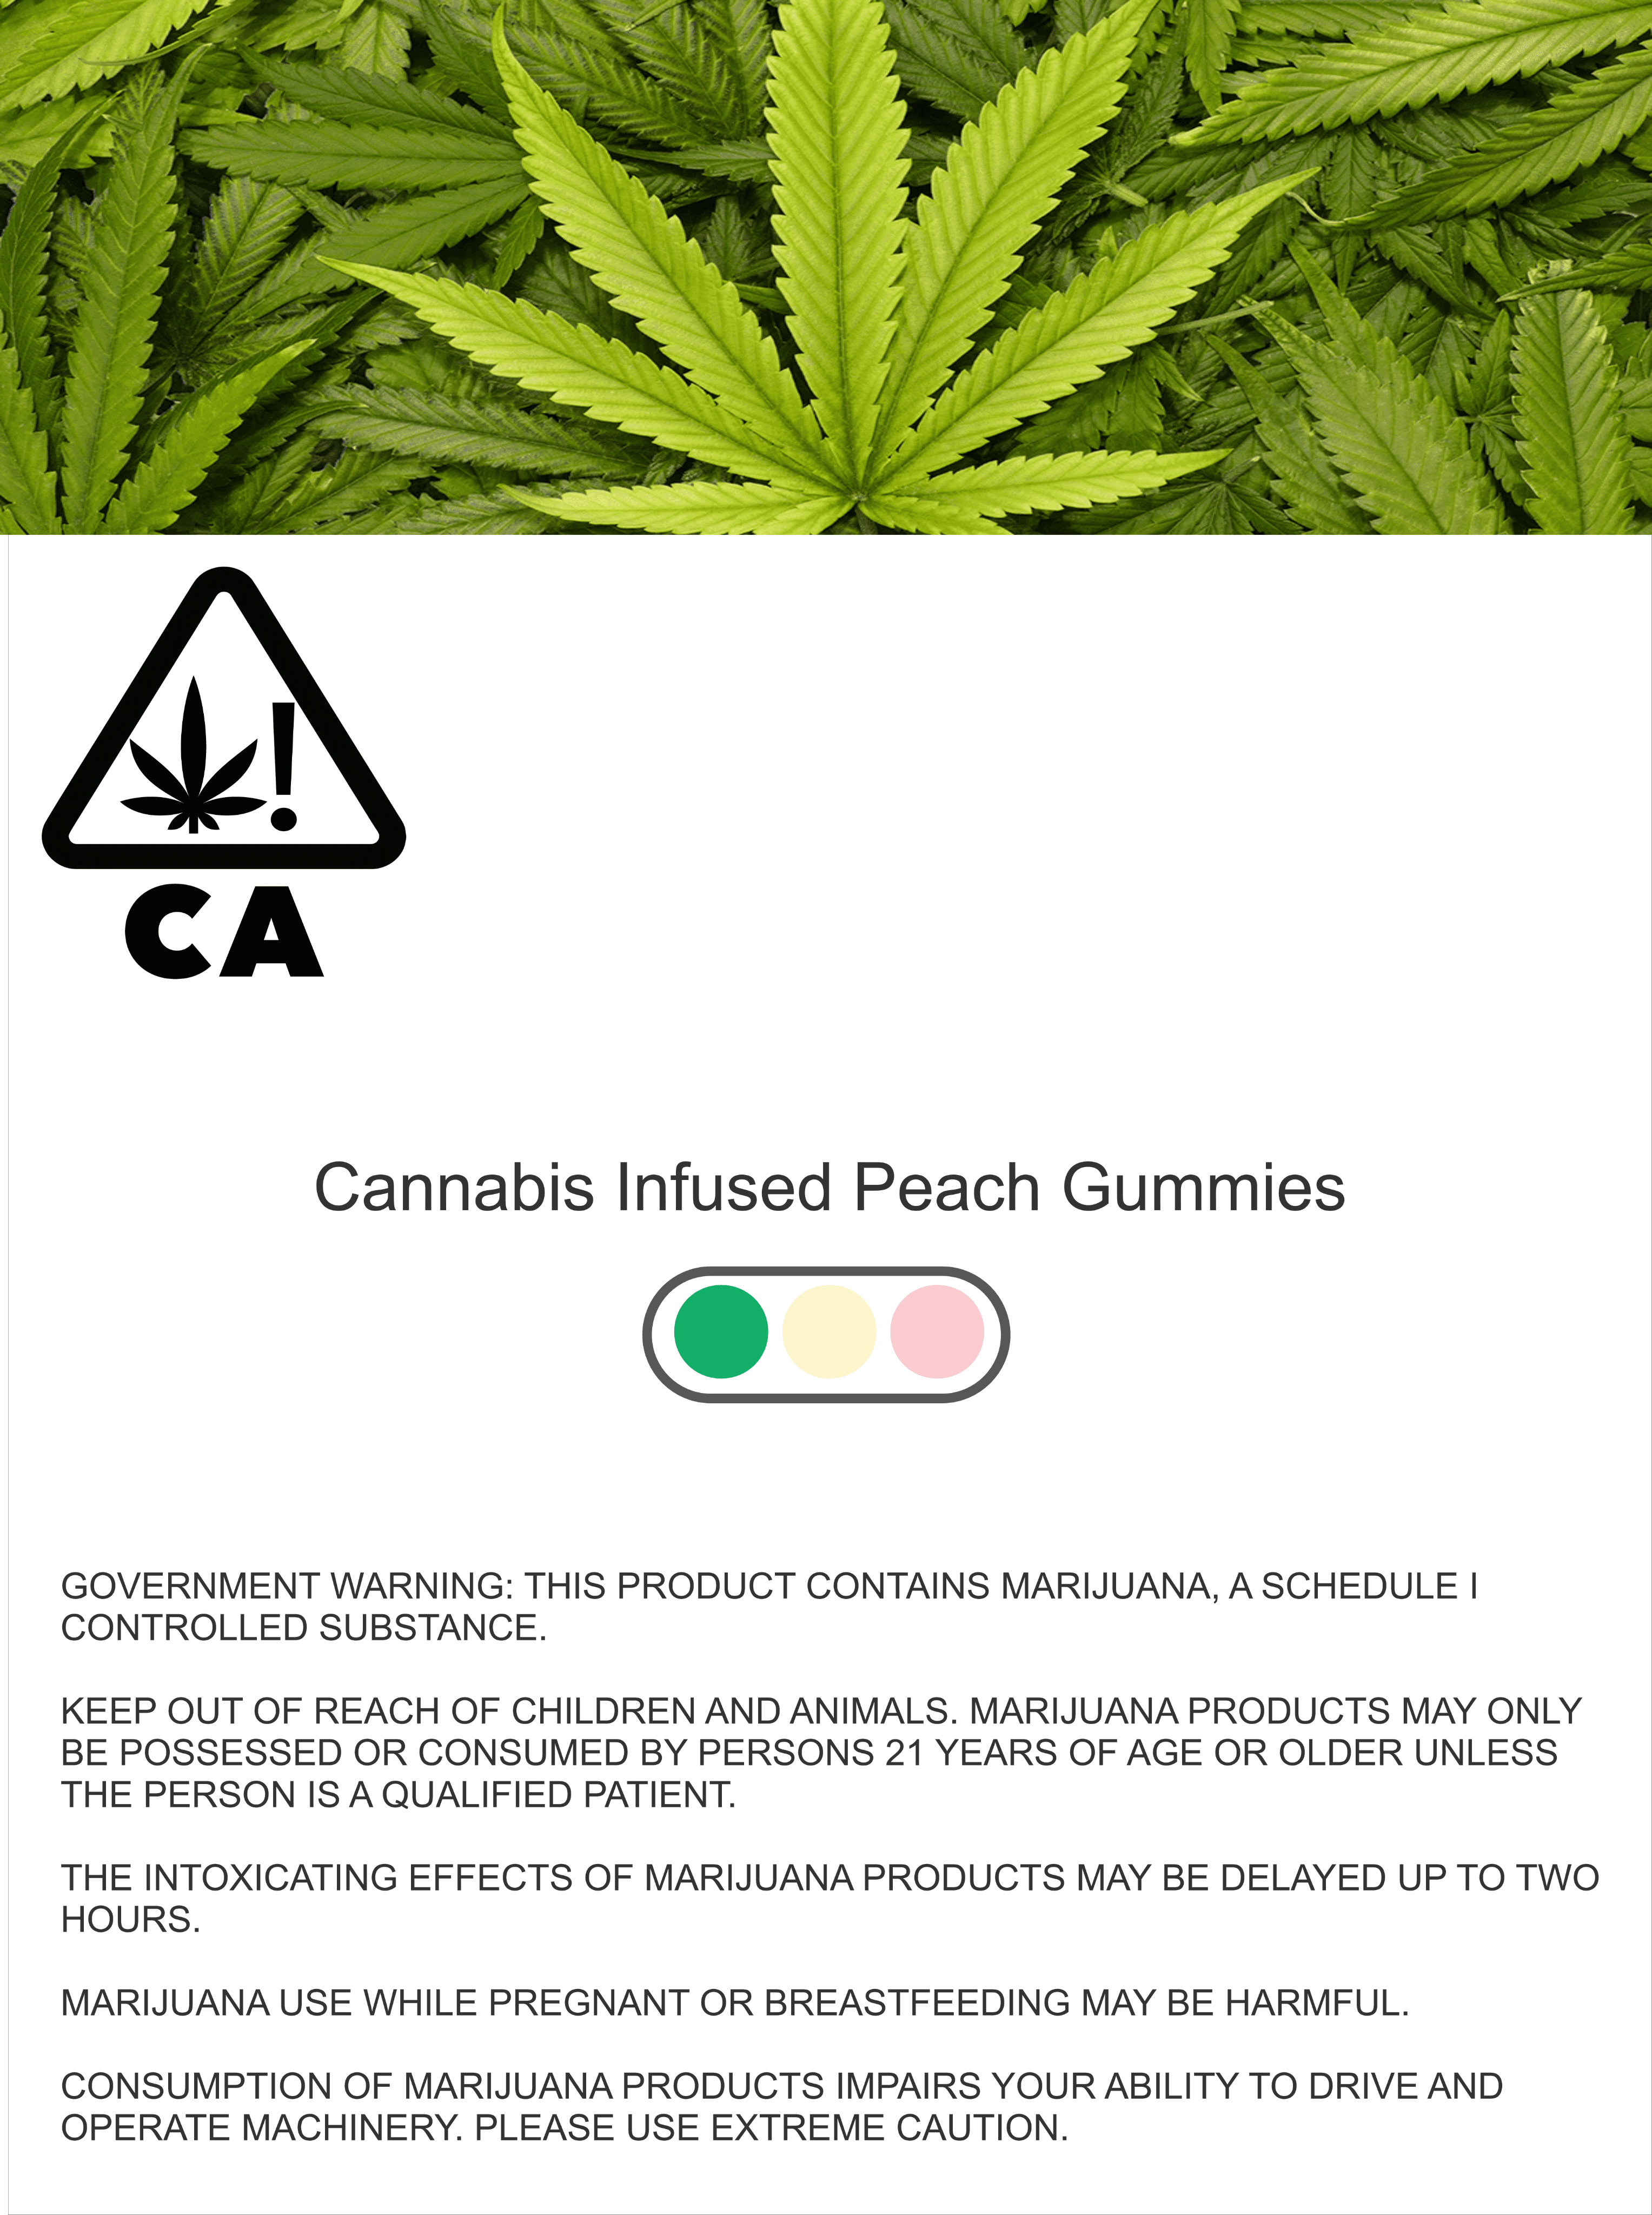


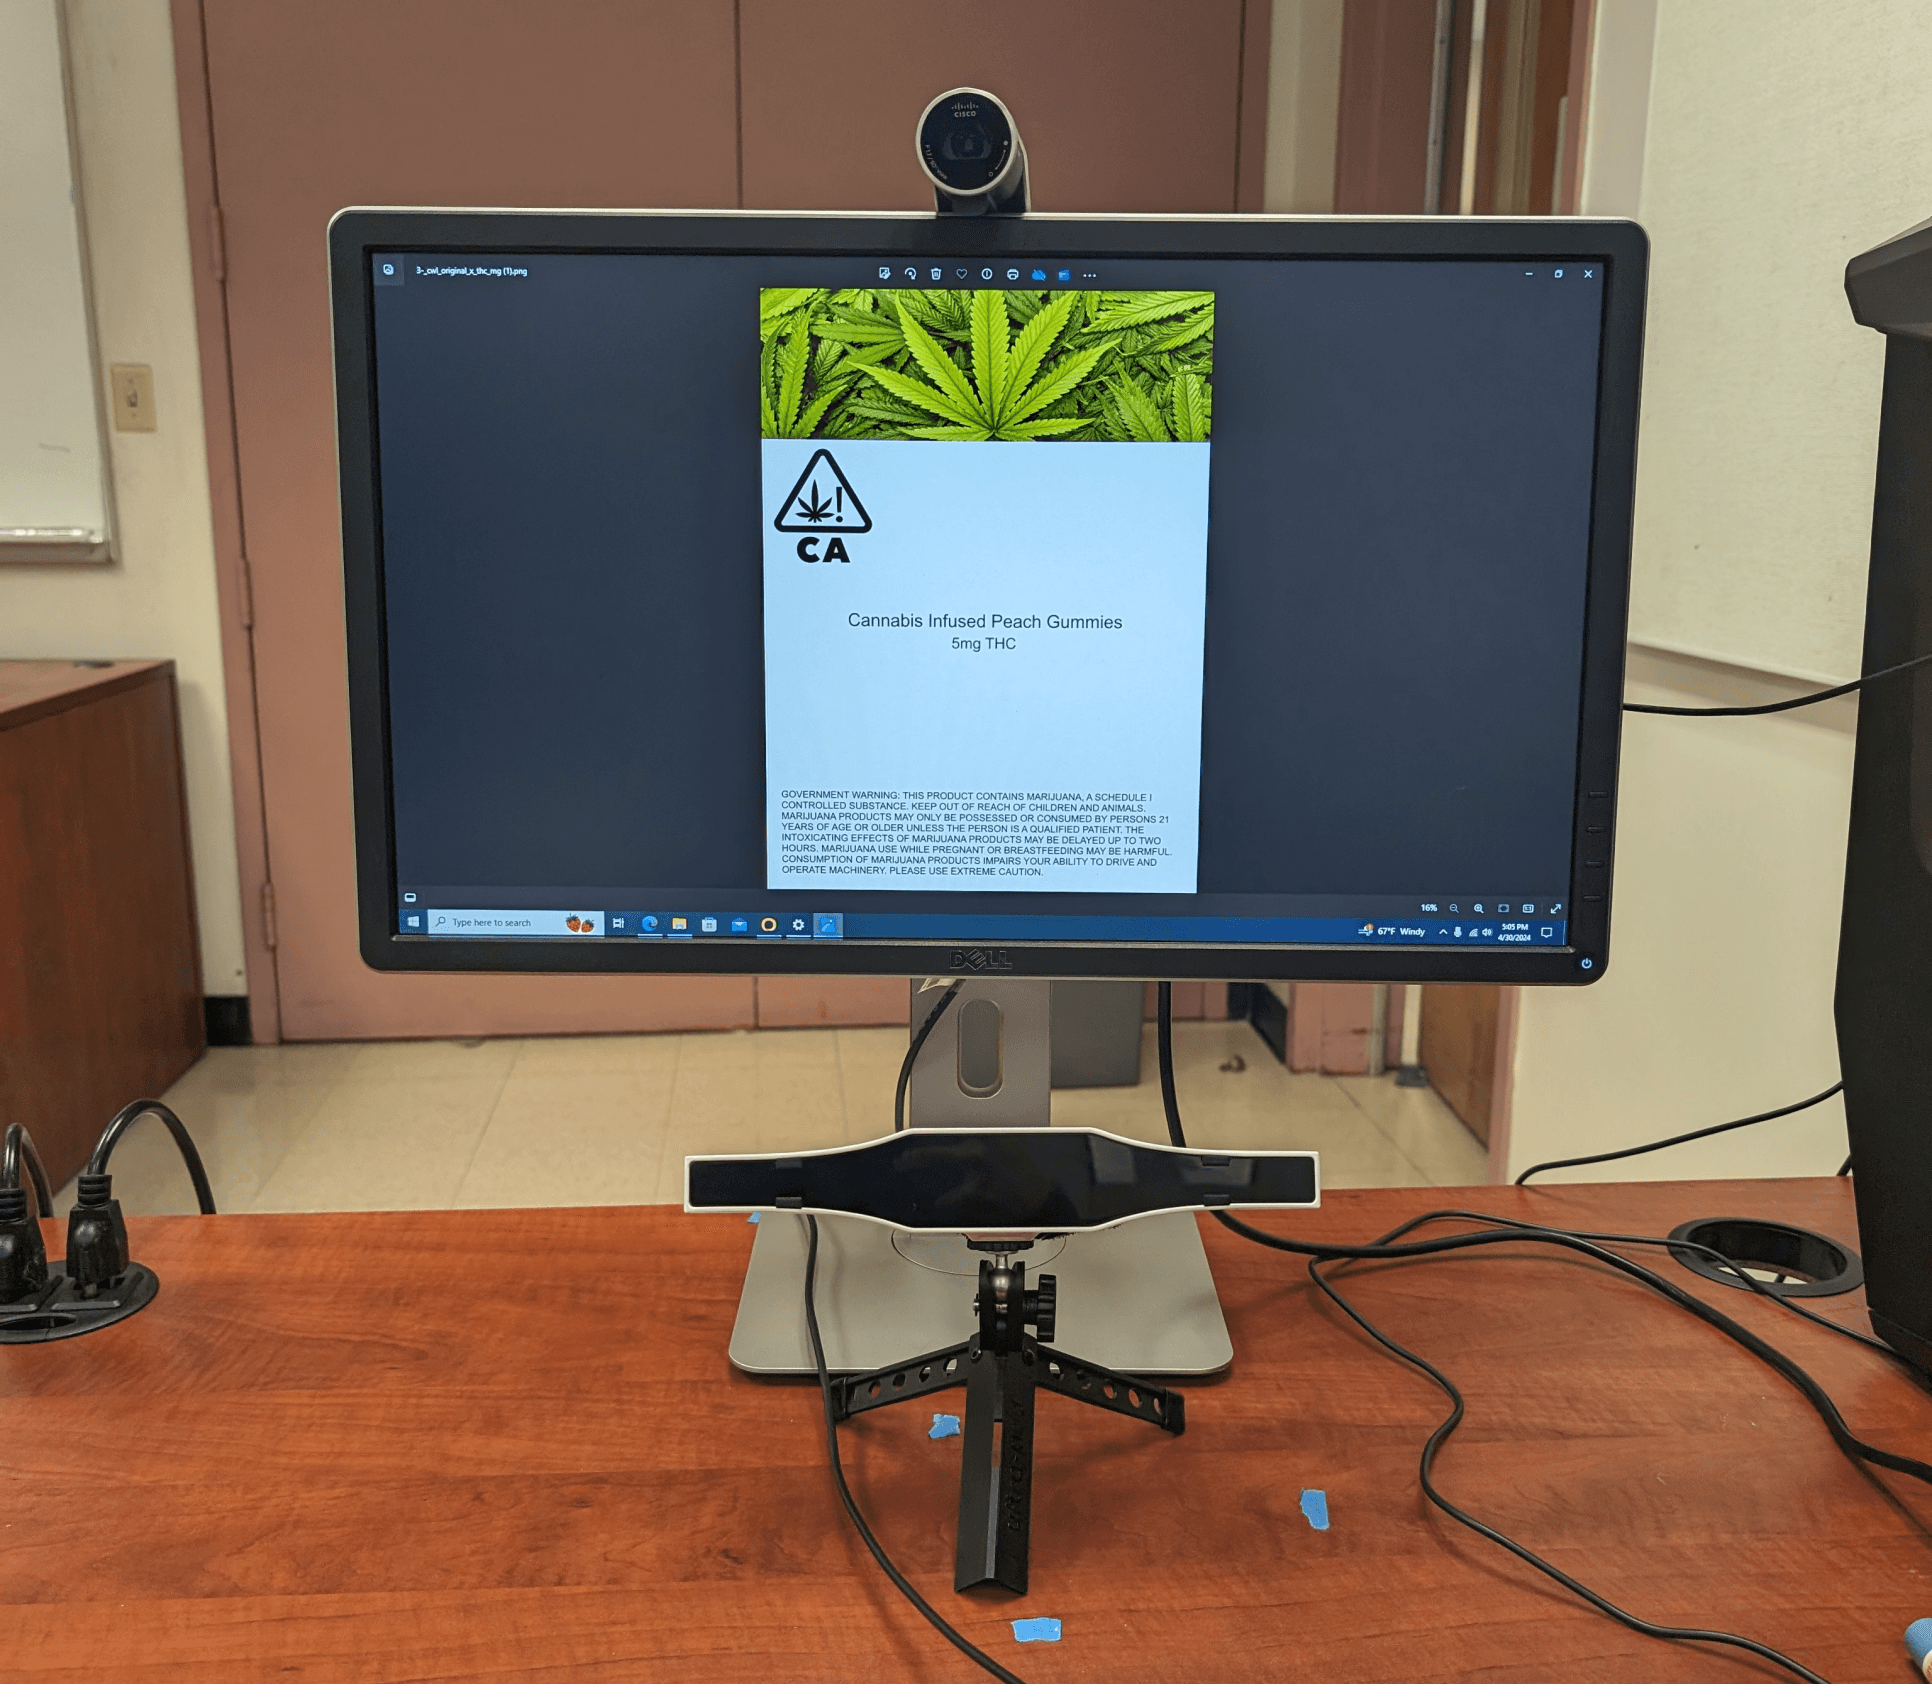
Examples of sample Cannabis Package labels viewed by participants in both Phase 1 and Phase 2.
Independent variables:
Cannabis label warning presentation (Original, bullet points, symbols)
Potency presentation (Traffic light, THC %, or MG)
Potency indicated on the label (high or low)
Phase 2: Comprehension Accuracy Test
Phase 2 of the study was a 3 x 3 x 2 factorial within-subjects full factorial design study where each participant experienced 18 conditions each.
The accuracy of the responses collected from the participants in the quiz section were coded with either a ‘1’ which indicated a correct response or ‘0’ which indicated an incorrect response.
Each image of a label they viewed was followed by two questions:
“Is this a low, medium, or high dose?”
Low
Medium
High
“The Cannabis Government Warning Label (the bottom section of the packaging) is easy to understand”
Strongly Agree
Agree
Neutral
Disagree
Strongly Disagree
PREFERRED THC%
5/24
PREFERRED TRAFFIC LIGHT
Traffic light notation is a subjective grading system - high potency for one person could be another person’s low potency.