MORTGAGE NOW
Creating a hi-fidelity interactive prototype dashboard which enables managers at two different levels to track and quantify performance and trends to measure and analyze productivity at a mortgage company.
MY ROLE
Product Designer
THE TEAM
Personal Project with guidance from professor and peers
TOOLS & METHODS
Axure RP 10, Figma, Communication with stakeholders

OVERVIEW
The goal of this project was to create a hi-fidelity interactive prototype dashboard with two separate use cases. This dashboard allows managers to track and quantify performance and trends to measure and analyze productivity for a loan mortgage company.
Although both personas have similar dashboards, they are interested in different types of information at different scales. The Operations Manager handles more of the everyday management, whereas the Chief Operating Officer (COO) handles large scale operations.
PROCESS
Design Specifications
We were given a design brief and requirements from the company sponsoring the project and so no research was conducted on our part. We had the opportunity to communicate and questions with the sponsor to get clarifications and fully understand the scope of the project, use cases, and needs.

Persona 1: Operations Manager (Tactical)

Persona 2: Chief Operating Officer (Strategic)
Goals
Goals
1. Better capacity management to ensure sufficient head
count and qualified talent are always retained to ensure
operations sales goals are met.
Decrease time to close on loans to maximize loan
throughput and minimize the cost of making loans.
2. Load balancing the teams during the week so they can
close number of commited loans.
Make her numbers for the month and quarter
3. Make the load balancing for the week forward
predictable and use those predictions to redistribute
work among operations staff.
Understand the economic and seasonal factors that
will affect her company's ability to hit their numbers.
BACKGROUND CONCEPTUAL WORK
Action Object Matrix
This method involves listing out the main actions (verbs) and objects (nouns) that a user would need to interact with to achieve their goals and ensuring that all the user needs and requirements are met. Creating a dense Action-Object Matrix helps reduce the complexity and the cognitive load that a user would need to exert in order to navigate through the website with ease.
An advantage of using this method is that it helps produce a shared vocabulary for a team, facilitates the creation of high level task scenarios, and most importantly it helps bridge the gap between the product requirements and the actual design concept.
The current design focused on a using an object-oriented approach for the global elements of the design, whereas lower level elements on individual screens had action-oriented CTA buttons.

Prioritization Matrix
Creating a Prioritization Matrix helps decide which aspects and use cases of the design needs to be made most accessible to the users. It's important to remember that the levels of prioritization isn't solely decided based on the users' needs, but rather a common ground between accomplishing user's overarching goals and fulfilling business objectives.
The most common goals that users need to accomplish should be the easiest to discover and complete. Thus actions and objects directly related to these goals need to be the most visible and require fewer clicks.
Operating Manager

Chief Operating Officer

DESIGN SOLUTION
Overview Screens
Both the Operations manager and the Chief Operating Officers have overview screens which displays information the most pertinent and relevant information to them and is shown in a way that would allow them to get a sense of how their employees are doing with a quick glance. This information is also highly prioritized in the prioritization matrix.


OM Loans Page
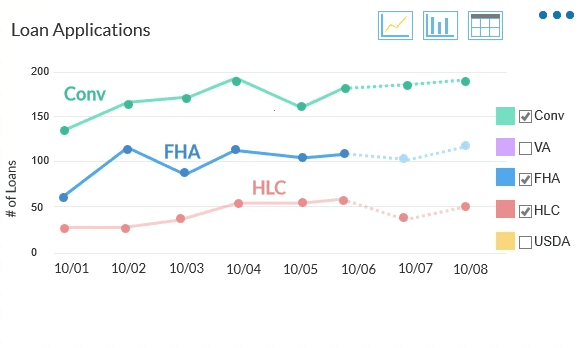
The OM's Loans page shows general information regarding loans including breakdown of the loans in the pipeline, a list of blocked loans, breakdown of actual milestones compared with the target and predicted across a specified time period, and the different types of loan applications coming in that week.
The list of blocked loans enables the OM to either nudge an employee that informs them that they are slowing down the progression of a loan, or they can also re-assign from here.
The list of blocked loans enables the OM to either nudge an employee that informs them that they are slowing down the progression of a loan, or they can also re-assign from here.
Loan Detail Page
The Operations manager is also able to quickly scan basic information about individual loans and its progress. The widget on the right shows the progress of the loan alongside the expected closing date and how each employee is performing compared to the expected target date per step of the loan.

So, they can also re-assign loans to other employees if they feel a particular loan would be better suited to another employee based on the loan progress displayed on the right.
Loan Reassignments
The Operations manager can reassign loans to a different employee based on several factors including average cycle time, the employees current workload, the number of total milestones completed.
The system also offers recommendations at the top based on performance and area of expertise.

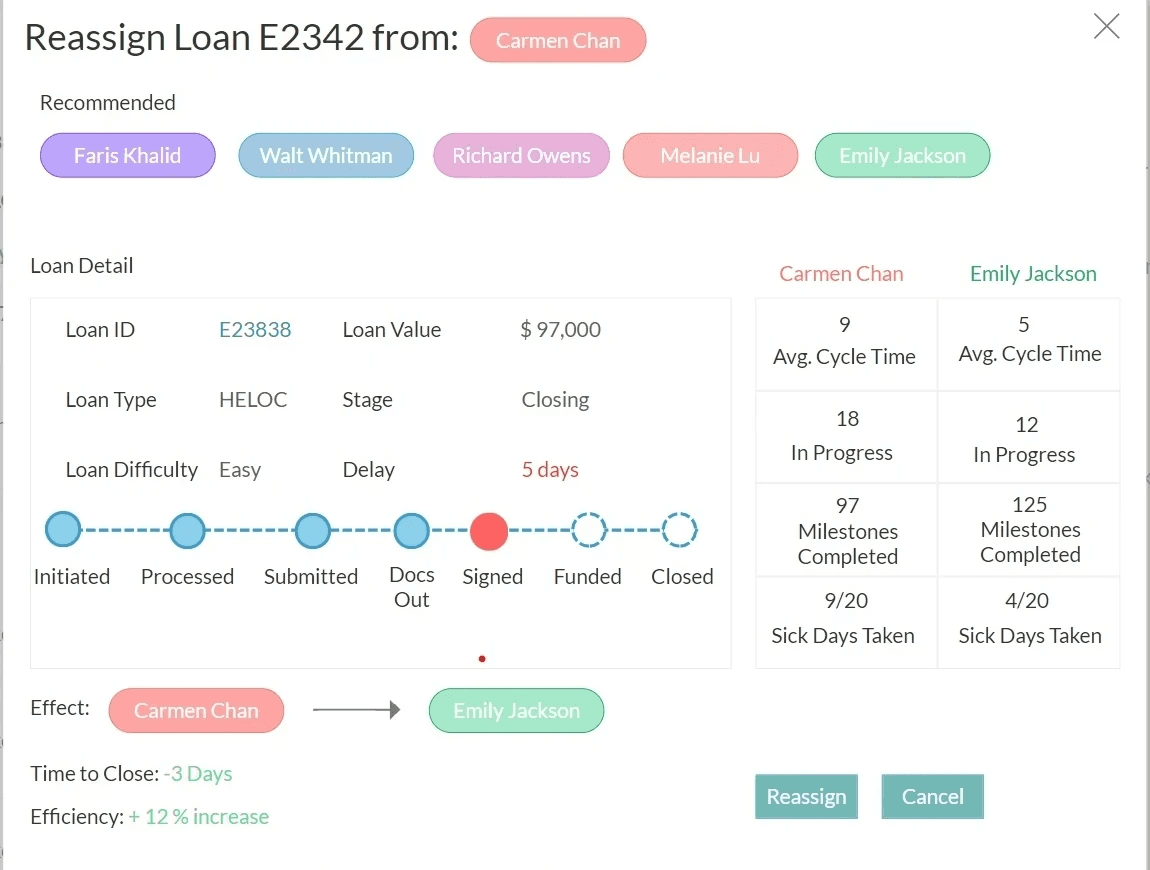
The system also displays the potential effect of re-assigning a loan on productivity by predicting the difference in the overall time to close caused by changing the employee working on a loan.
Global Search Results Page
The Operations Manager is able to use the global search at the top of each screen to create search queries which leads to a search results screen.
On this page every entry of the search which matches the keyword appears.
In this example, a search query of "Carmen" results in 3 employees with the same first name, 14 loans processed by a Carmen, and any notes made by Carmen or where Carmen was mentioned.
The Loan Table is actionable whereby the OM may directly interact with the table to get to a loan detail page, and can also reassign loans from the search page if they wish to. The OM can also click the employee cards to get to the Employee detail page.

Operations Manager Employee Detail Screen
The Operations Manager is able to view relevant specific details about every employee including:
Employee details
General metrics which are used to measure performance
Blocked loans the employee is working on (where the OM can also reassign loans)
Cycle time per role type for each employee
Loan history from which individual loans the employee has worked on can also be accessed, searched through, and filtered as well.

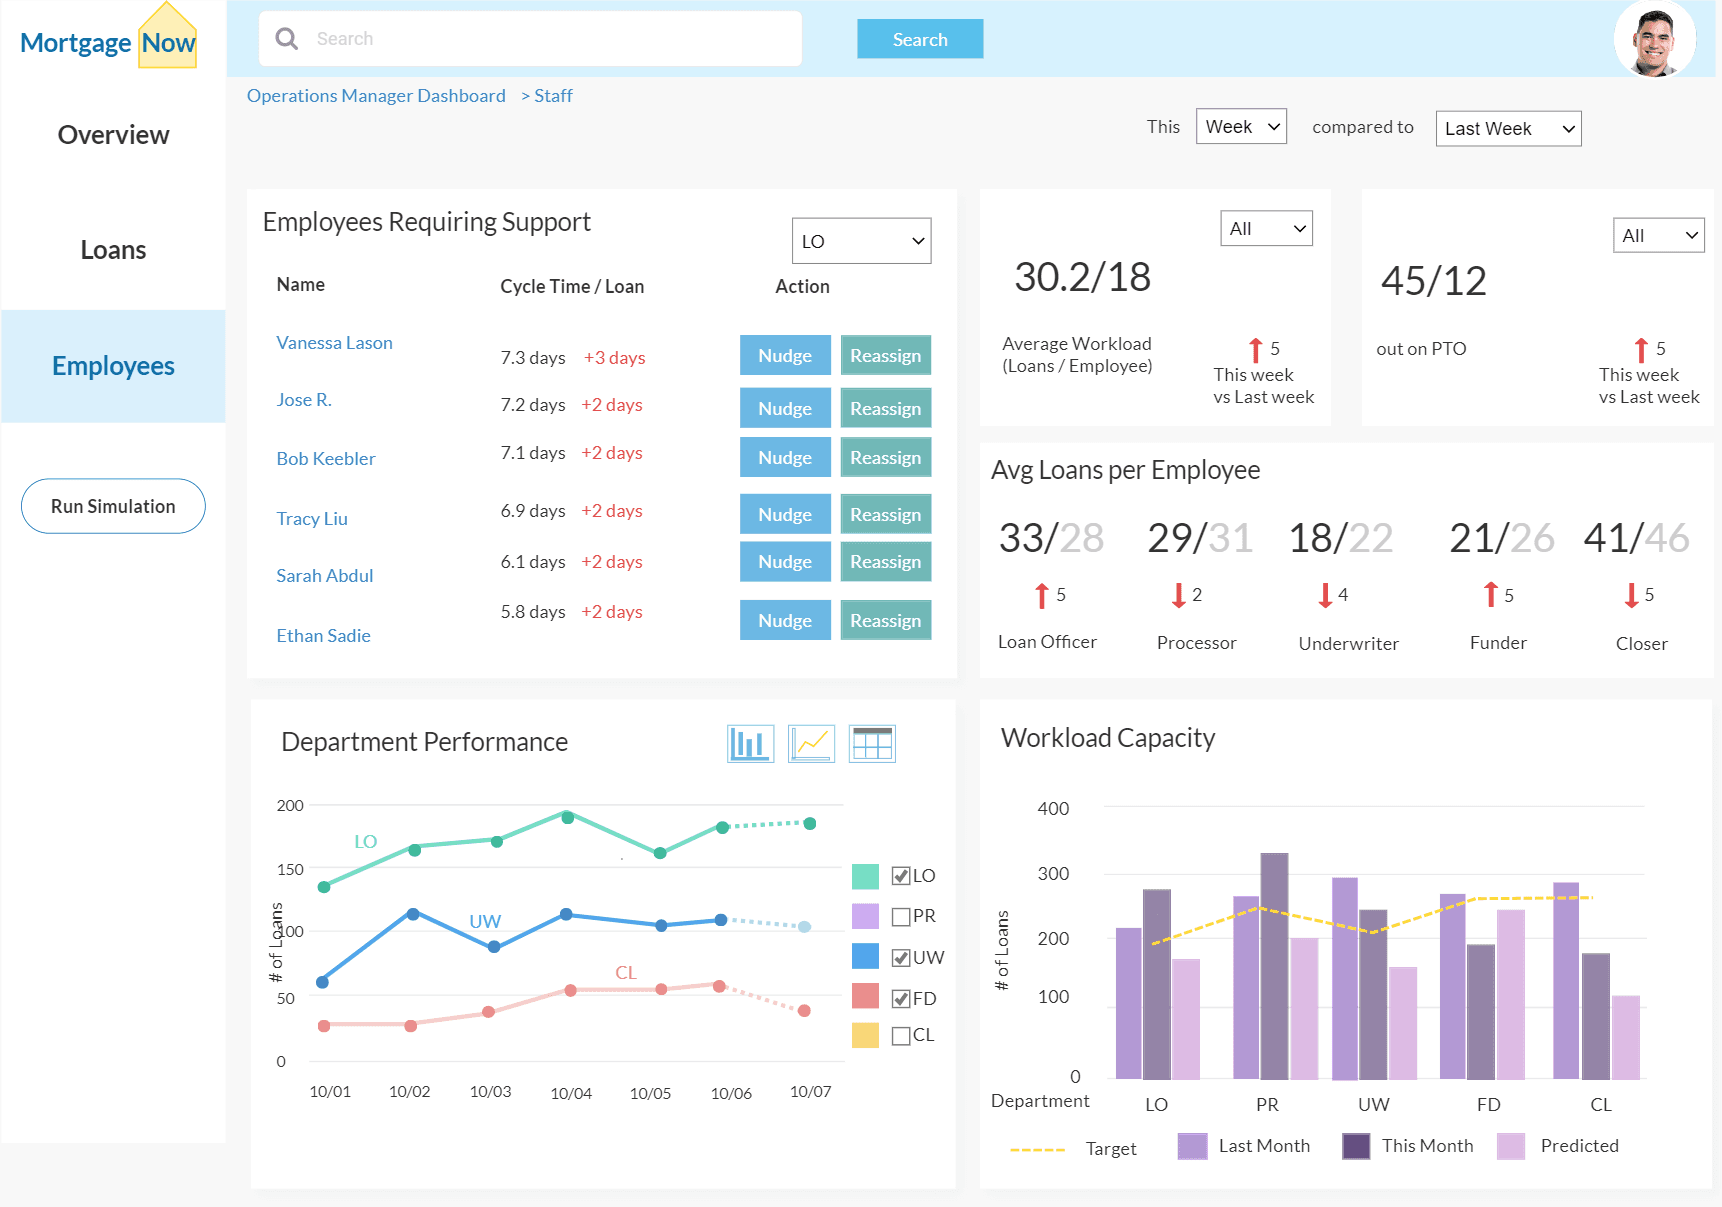
OM Employees Page
The Operations manager is also able to see general information on employees. The top left widget shows employees who require more support which the OM can use to rebalance the loans and provide some relief for employees with a large workload.
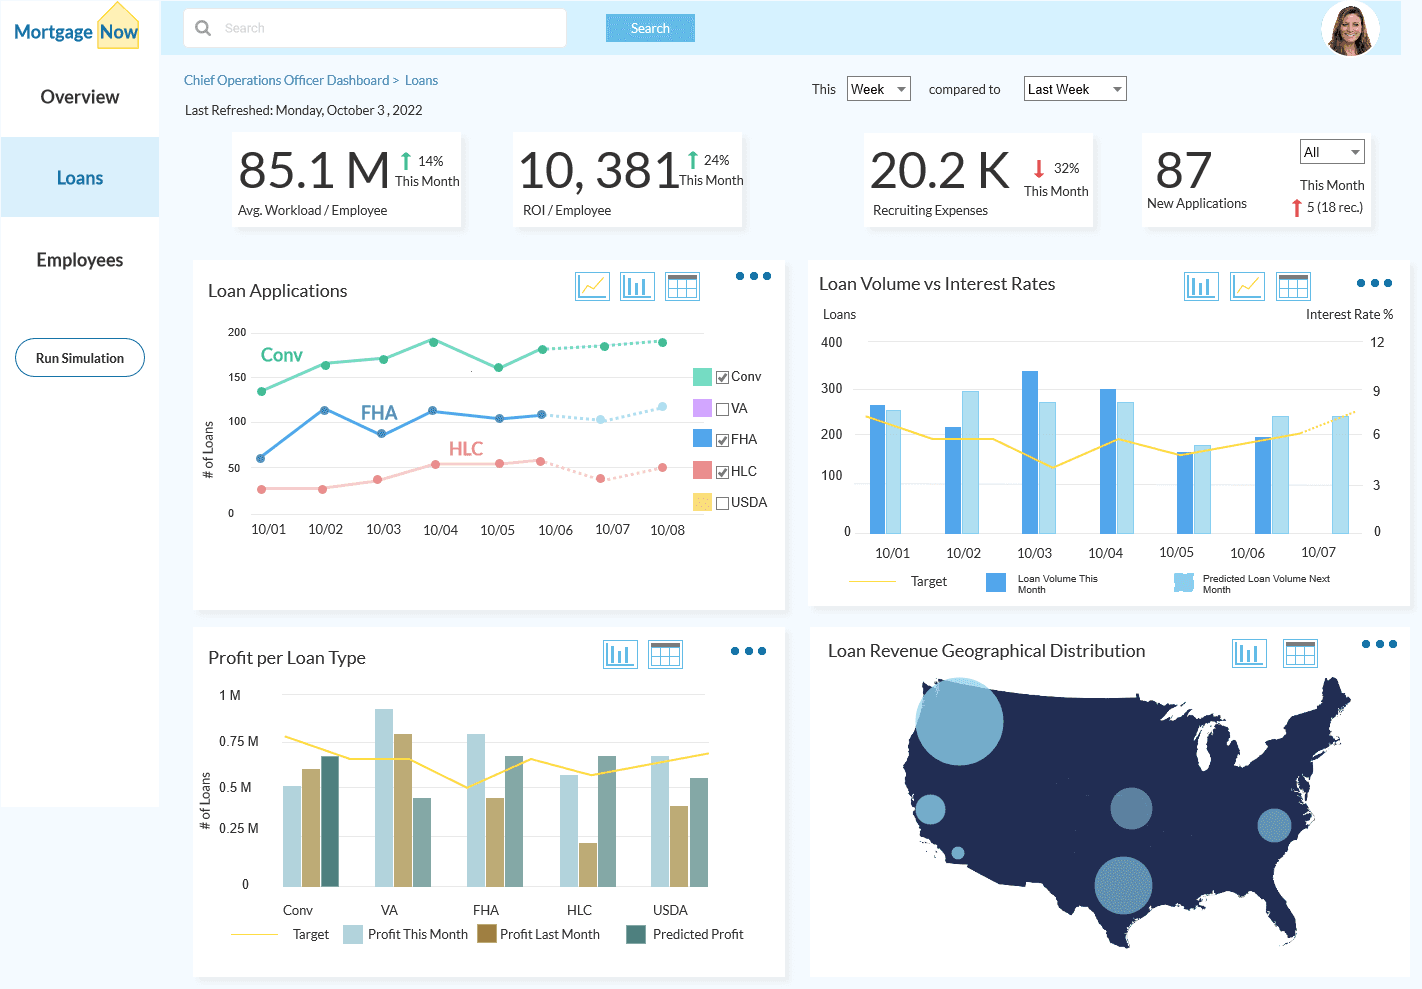
COO Loans
Loan information that is relevant to the COO links profits, the number of loan applications coming in, interest rates vs. loan volume and the geographic distribution of the loan revenue.

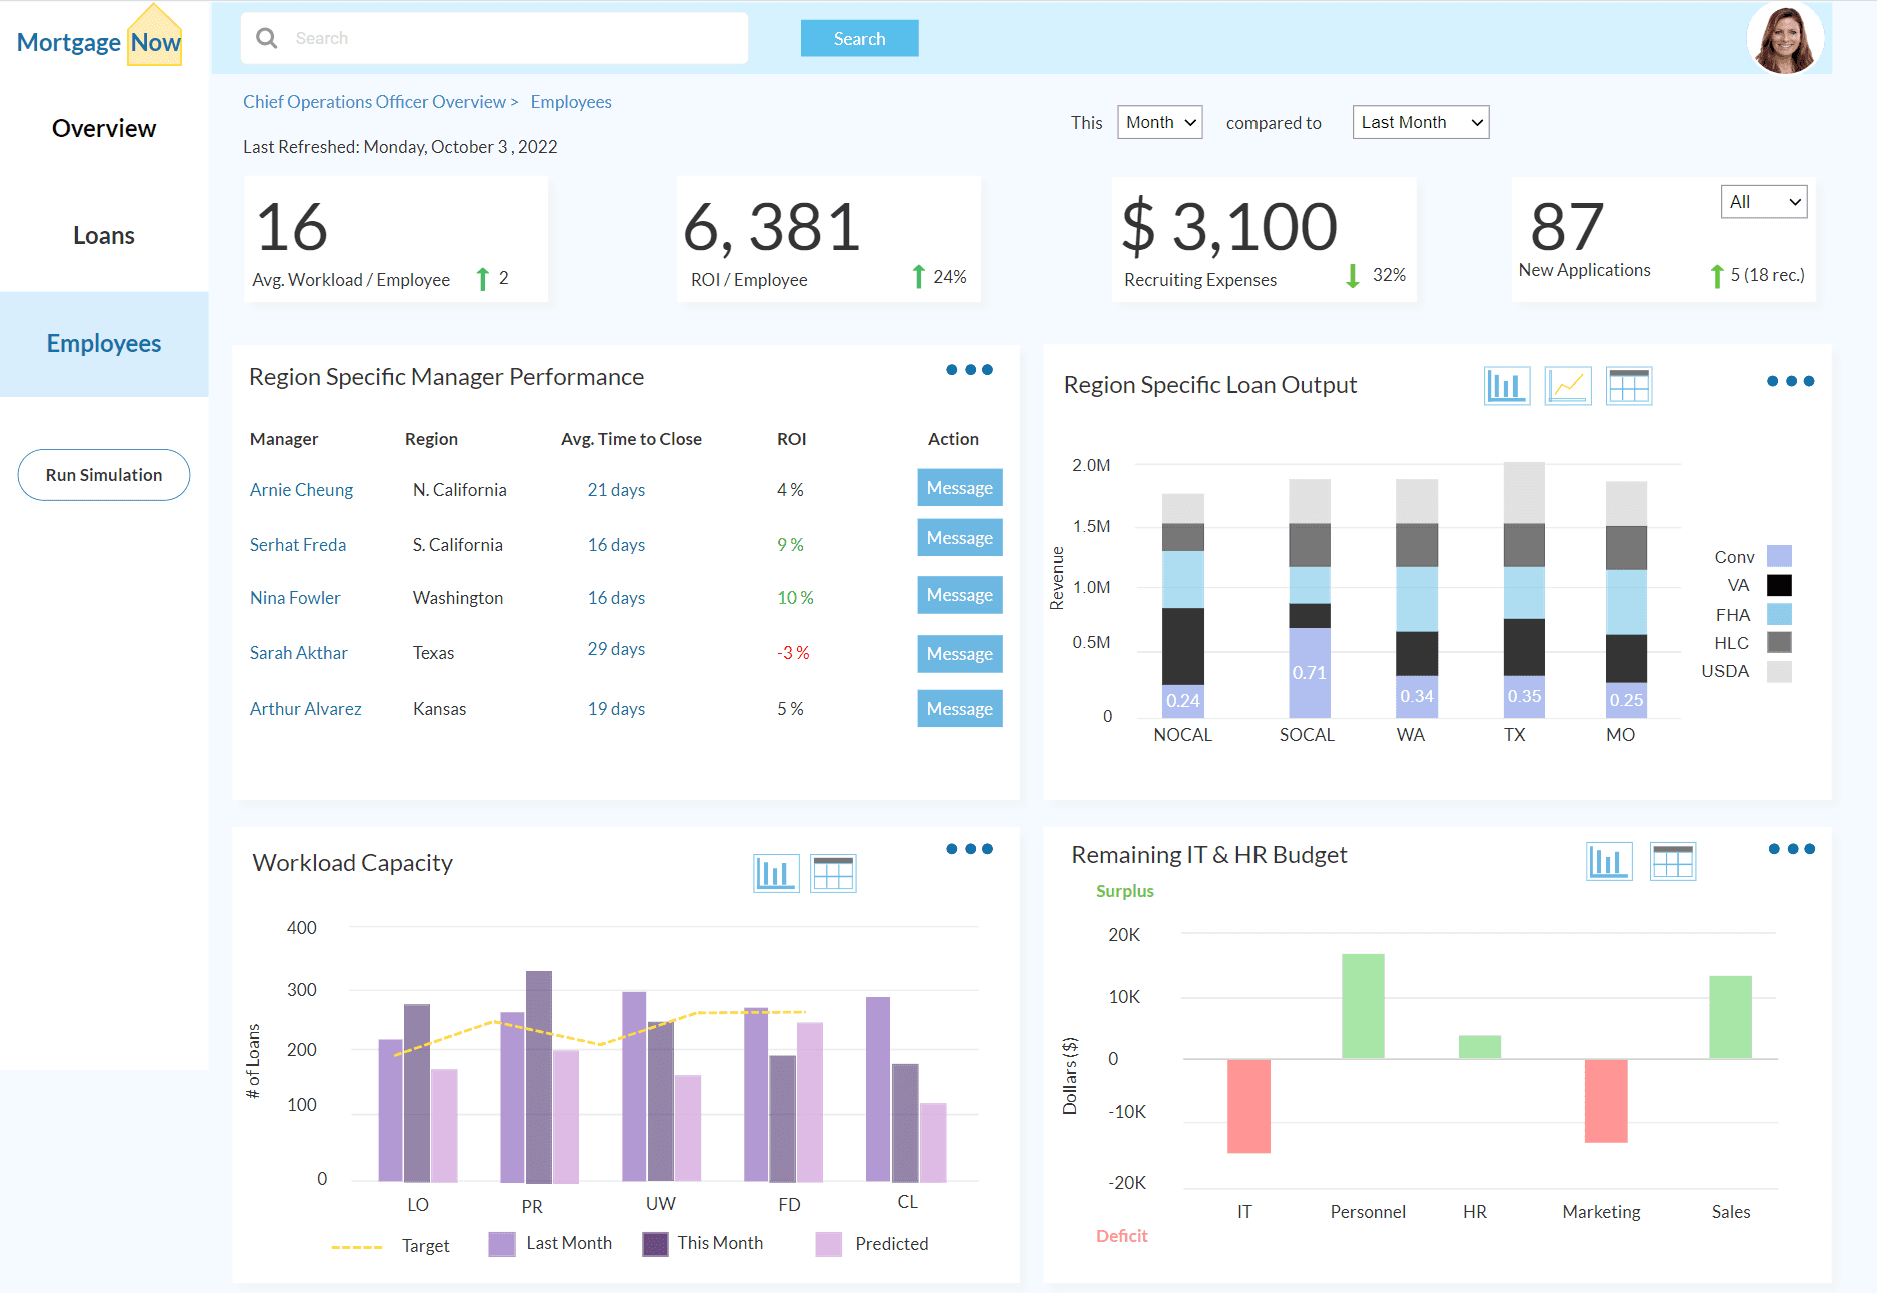
COO Employees
The COO is able to see overall productivity and capacity of employees on a much larger scale across multiple branches compared to the OM. All metrics for the employees link back to revenue and headcount in order to maximize profits.
COO Scenario Builder
The COO is able to build scenarios to help her predict what the average time to close loans, the average cycle time, and the expected number of loans that will be closed in a certain time period based on macro-economic factors and internal company specific factors.
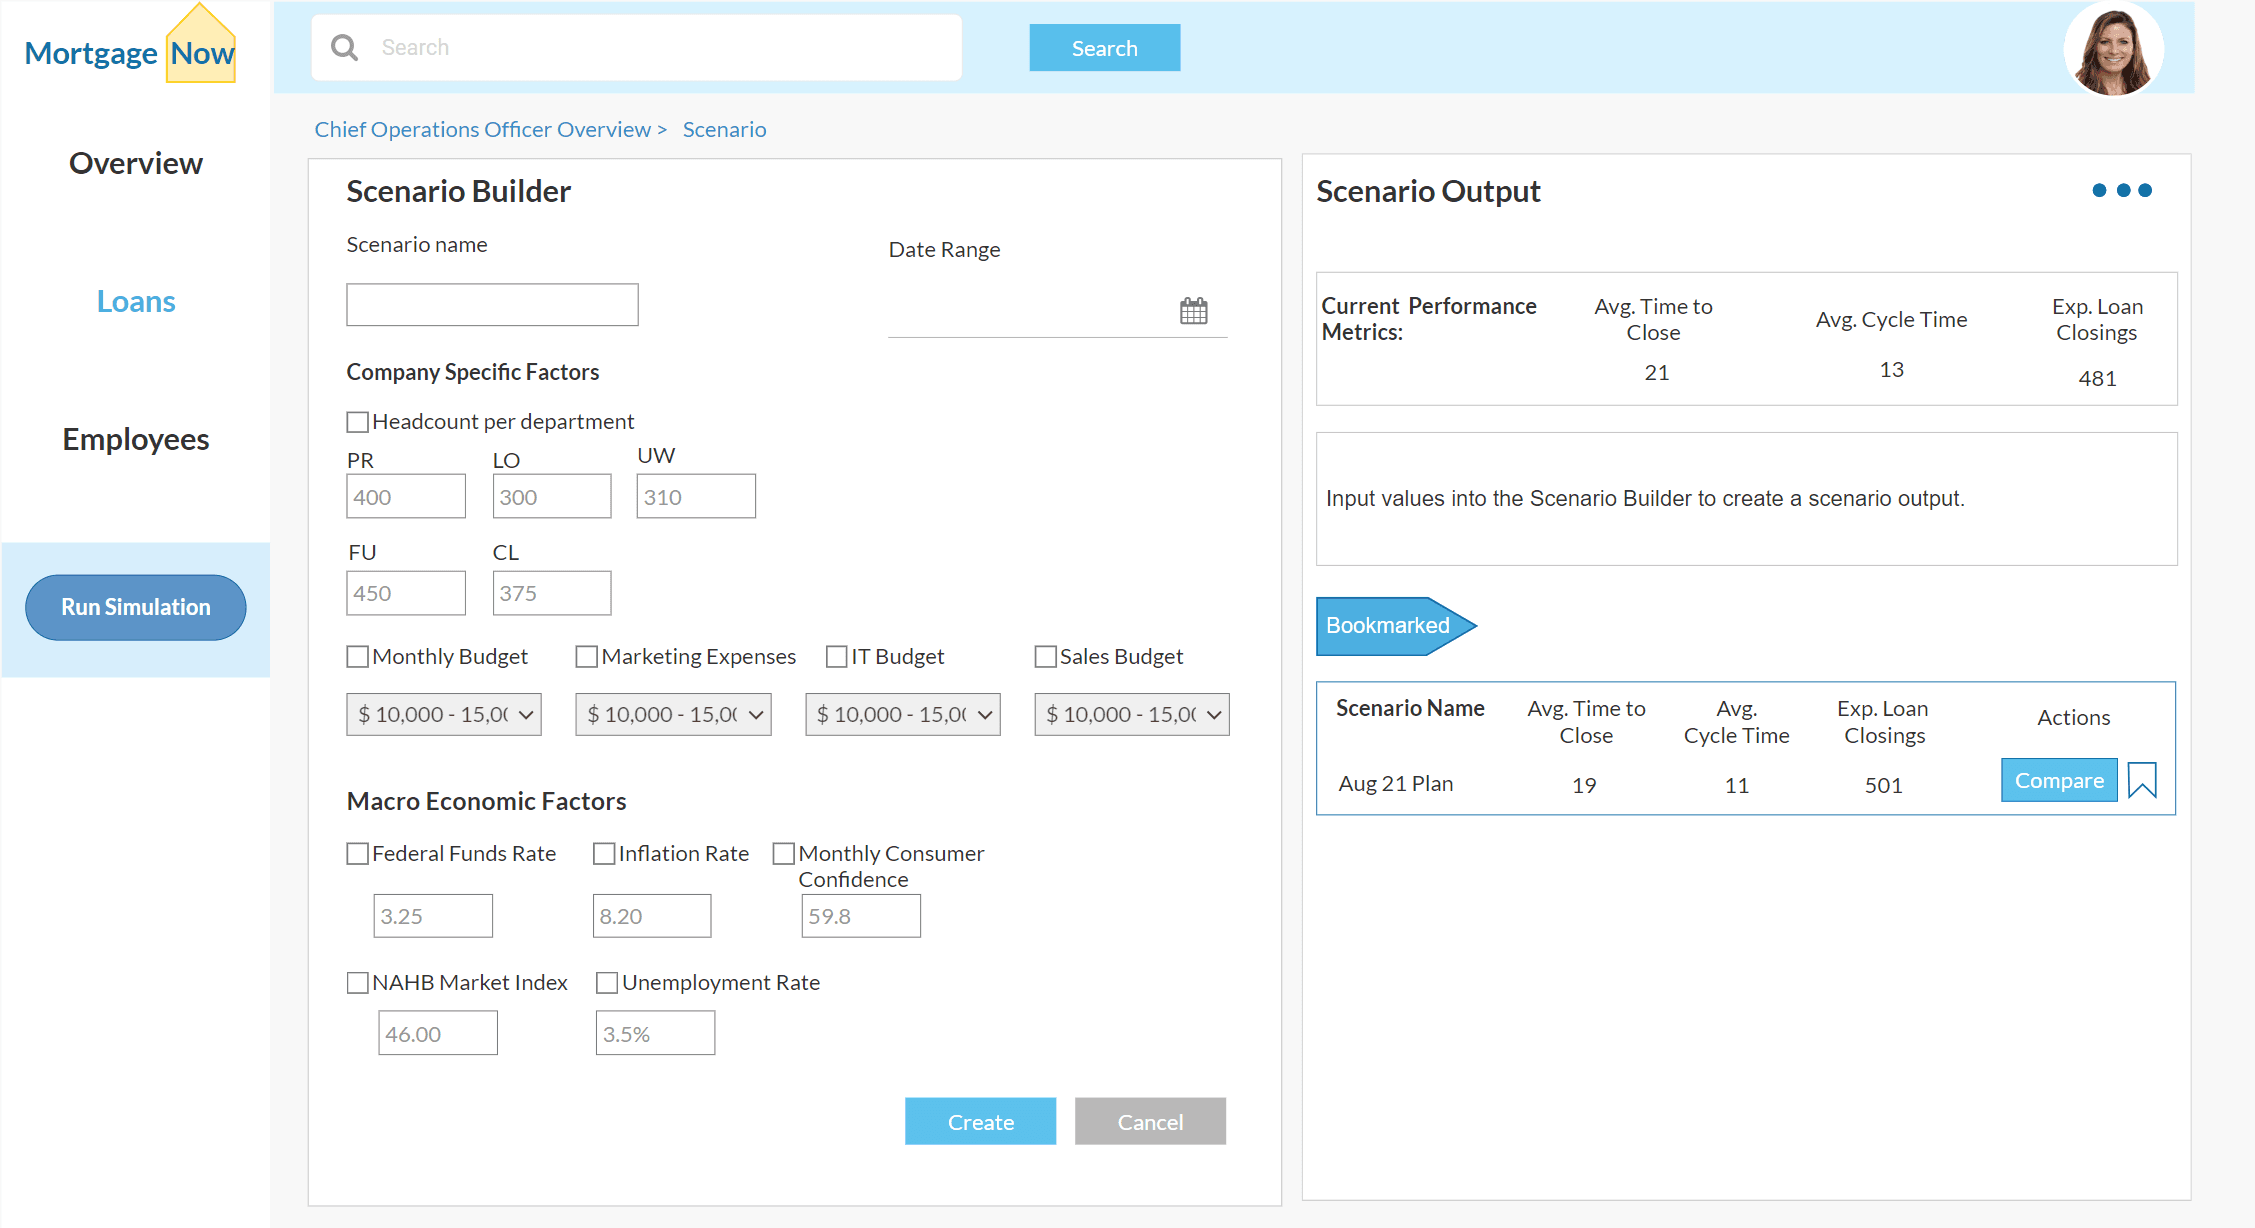
The COO would also be able to bookmark scenarios and also to make comparisons between them.
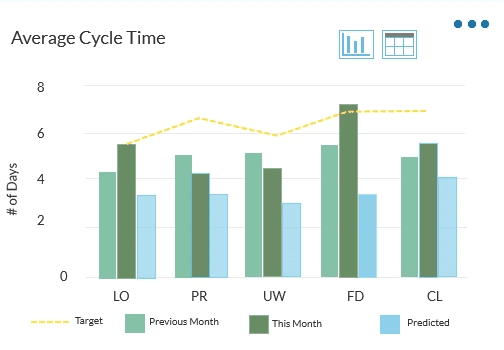
Data Visualization
One of the most important components of this project was accounting for the fact that different types of information needs to be conveyed and presented in different ways in order to aid understanding.
The presentation type and graphs used also depend on what variables and metrics are being compared. So, there is a variety of different chart types that are shown - additionally, the users would have the ability to toggle between different presentation formats depending on their needs and preferences.